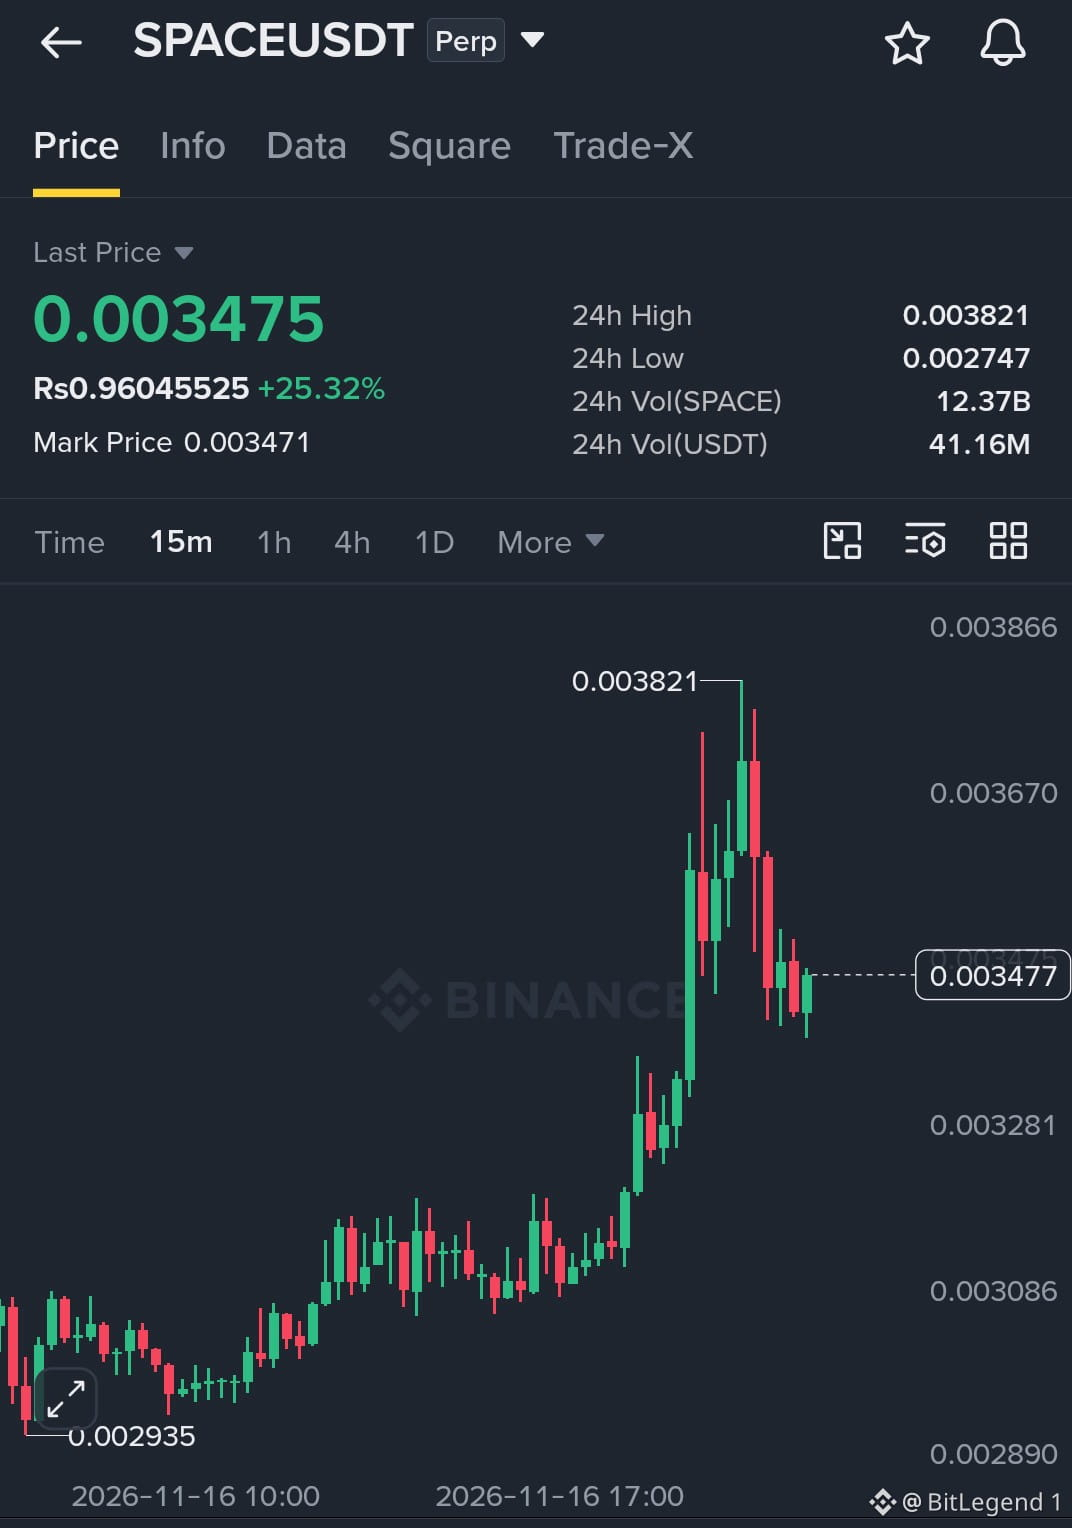

$SPACE USDT is up 25.32% in 24 hours, but the most interesting part of this chart is what happened AFTER the breakout.
On the 15-minute timeframe, SPACE climbed from the visible low of 0.002935 to a high of 0.003821 before pulling back toward 0.003475. That represents an approximate 30.1% rise from the visible low to the peak, followed by a noticeable rejection from the highs.
The price is now hovering around 0.003475, roughly 9.1% below the peak. The breakout brought strong upward momentum, but the subsequent red candles suggest that some selling pressure has emerged as price moved higher.
Here’s the key detail: the 0.00345–0.00348 area is where price is currently trying to stabilize. If buyers manage to defend this region and build momentum again, the market could attempt another move toward 0.00367 and the previous high near 0.003821. On the other hand, losing this area could expose the lower 0.00328 region as a level to watch.
Neither scenario is confirmed yet. The next few 15-minute candles could reveal whether this pullback is simply a pause after a strong rally or the beginning of a deeper correction.
What stands out more to you on SPACEUSDT right now: a healthy pullback before another attempt higher, or weakening momentum after the sharp rally?
On the 15-minute timeframe, SPACE climbed from the visible low of 0.002935 to a high of 0.003821 before pulling back toward 0.003475. That represents an approximate 30.1% rise from the visible low to the peak, followed by a noticeable rejection from the highs.
The price is now hovering around 0.003475, roughly 9.1% below the peak. The breakout brought strong upward momentum, but the subsequent red candles suggest that some selling pressure has emerged as price moved higher.
Here’s the key detail: the 0.00345–0.00348 area is where price is currently trying to stabilize. If buyers manage to defend this region and build momentum again, the market could attempt another move toward 0.00367 and the previous high near 0.003821. On the other hand, losing this area could expose the lower 0.00328 region as a level to watch.
Neither scenario is confirmed yet. The next few 15-minute candles could reveal whether this pullback is simply a pause after a strong rally or the beginning of a deeper correction.
What stands out more to you on SPACEUSDT right now: a healthy pullback before another attempt higher, or weakening momentum after the sharp rally?