
$BNB is showing signs of a short-term recovery, but the bigger market trend is still sending warning signals. Is this the beginning of a bullish reversal, or just another temporary bounce?
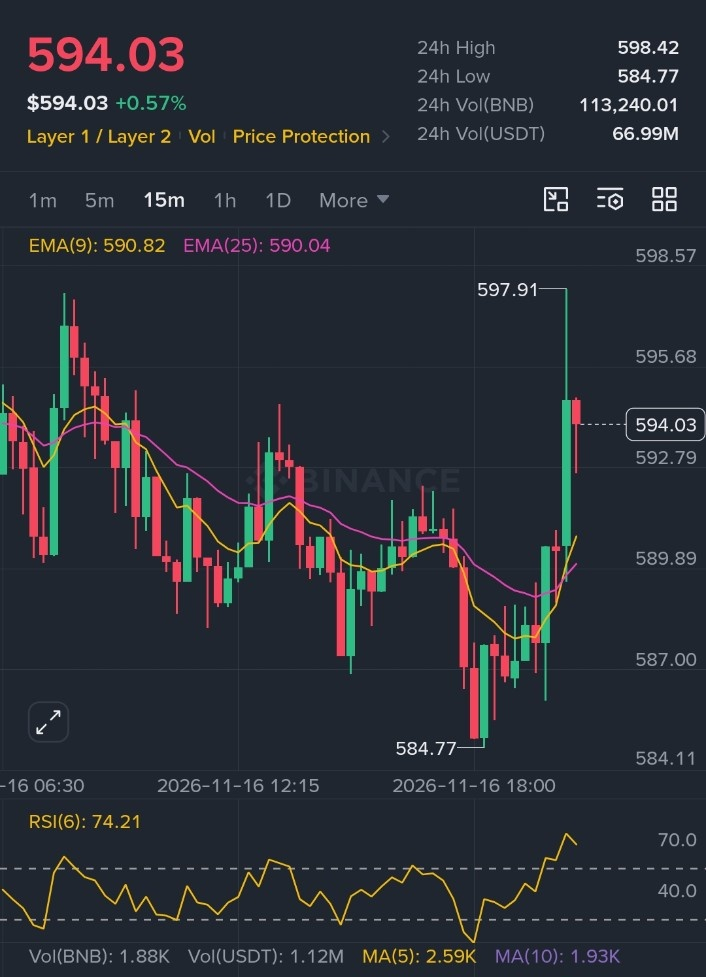
#BNB is trading around $594.03, up 0.57% over the last 24 hours according to the Binance chart snapshot analyzed on November 16, 2026.
The latest price action shows buyers stepping back into the market after BNB touched a recent low of $584.77.
However, there is an important distinction between a short-term recovery and a confirmed trend reversal.
Let's examine the technical picture, market sentiment, fundamentals and possible trading opportunities.
1. BNB Market Overview
According to the provided Binance trading snapshot:
Current price: $594.03
24-hour change: +0.57%
24-hour high: $598.42
24-hour low: $584.77
24-hour trading volume: 113,240.01 BNB
USDT trading volume: $66.99 million
BNB is showing positive short-term momentum, but the broader market remains under pressure.
Available market data places BNB around the fourth-largest cryptocurrency by market capitalization, with approximately 131.51 million BNB in circulation and a market capitalization near $77.5 billion. These figures vary with the market price and data provider.
2. Technical Analysis: Buyers Are Regaining Control
The 15-minute Binance chart provides the clearest evidence of the recent recovery.
EMA Analysis
EMA 9: $590.82
EMA 25: $590.04
Current price: $594.03
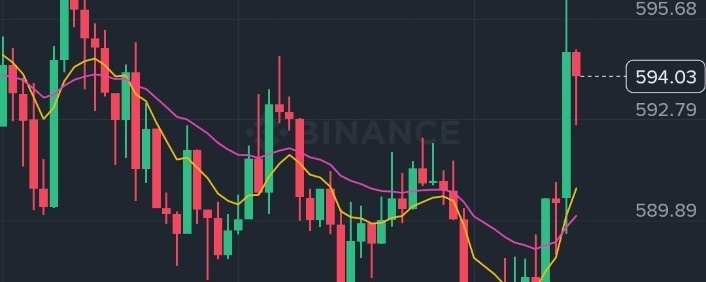
The 9-period EMA is above the 25-period EMA, while the market price is trading above both indicators.
This indicates improving short-term buying pressure.
However, the RSI(6) is approximately 74.21, placing short-term momentum in overbought territory.
That creates two possibilities: BNB could continue higher if buyers maintain control, or the market could experience a temporary pullback as traders secure profits.
Important Resistance Levels
$598: Immediate resistance.
$603: Major breakout confirmation area.
$610: Potential upside target.
$616: Next resistance zone.
Important Support Levels
$590: Immediate support.
$585: Recent swing-low support.
$578: Potential downside target if selling accelerates.
A sustained breakout above $603 with increasing volume would strengthen the bullish scenario.
3. Higher-Timeframe Trend: The Important Warning
The short-term chart looks constructive, but higher timeframes tell a different story.
Available technical readings indicate that BNB remains below several important daily moving averages.
The daily RSI is approximately 26, while the MACD remains negative.
The 4-hour and weekly technical assessments also show bearish pressure.
This means the current recovery should be treated cautiously.
A genuine bullish reversal requires more than one strong green candle. Buyers need to reclaim important resistance levels and maintain them.
4. Fundamental Strength: Why BNB Still Matters
BNB has an established role within the broader Binance and BNB Chain ecosystem.
Its utility includes:
Transaction fees on BNB Smart Chain.
Participation in decentralized finance.
Ecosystem applications and services.
Governance-related utility.
Certain Binance trading-fee benefits.
Another important development was the 37th quarterly BNB burn, completed on October 19, 2026.
According to BNB Chain, approximately 1,646,196.44 BNB was burned, worth around $1.197 billion at the time.
Token burns reduce supply, but their long-term price impact depends on actual demand and market conditions.
5. The Overall Crypto Market Is Still Weak
One of the biggest challenges for BNB is the broader cryptocurrency environment.
The November 16 market snapshot showed:
Total crypto market capitalization: approximately $2.18 trillion.
Bitcoin dominance: 59.26%.
Ethereum dominance: 10.10%.
Fear and Greed Index: 10/100.
Stablecoin supply: approximately $287.30 billion.
A Fear and Greed reading of 10 indicates extreme fear.
This environment makes sustained altcoin rallies more difficult.
Even when individual assets recover, broader market weakness can quickly reverse buying momentum.
6. Bullish vs Bearish Scenarios
Bullish Scenario
If BNB breaks above $598 and confirms a sustained move above $603, buyers could target:
First target: $610.
Second target: $616.
Extended target: $622.
Stronger volume and improving Bitcoin sentiment would support this scenario.
Bearish Scenario
If BNB loses the $590 support zone, sellers could push the price toward:
First target: $585.
Second target: $578.
Extended downside: $565 if broader market weakness increases.
A sustained breakdown below $584.77 would weaken the current recovery structure.
7. BNB Price Outlook
My conditional scenario ranges are:
Next 24–48 Hours
Bullish: $603–$610.
Neutral: $588–$603.
Bearish: $578–$585.
Next 7 Days
Bullish: $610–$622.
Neutral: $578–$610.
Bearish: $565–$578.
Next 30 Days
Bullish: $630–$660.
Neutral: $565–$630.
Bearish: $530–$565.
These are analytical scenarios, not guaranteed predictions.
8. Trading Strategy: What Should Traders Watch?
Chasing BNB at $594 after a strong short-term move could be risky.
A potential spot entry area is $588–$591, provided buyers defend that zone and a bullish candle confirms the recovery.
Possible trading levels:
Entry zone: $588–$591.
Invalidation: Below $583.
Take Profit 1: $598.
Take Profit 2: $603.
Take Profit 3: $610.
Alternatively, a confirmed breakout above $603 followed by a successful retest could offer another opportunity.
Futures traders should be particularly careful with leverage because the higher-timeframe trend remains bearish.
Capital protection matters more than chasing every price movement.
9. Final Verdict: Is BNB Bullish or Bearish?
BNB is showing a promising short-term recovery, but the larger trend has not yet confirmed a reversal.
The strongest bullish signal is the 15-minute EMA crossover and price recovery above $590.
The strongest bearish warning is the elevated short-term RSI combined with weak daily and weekly momentum.
My conclusion:
Short-term: Bullish recovery.
Medium-term: Cautious.
Long-term: Bearish until stronger confirmation.
Major support: $590.
Major resistance: $603.
Important upside target: $610.
Important downside target: $578.
For now, waiting for confirmation appears more sensible than entering blindly.
The next decisive move around $598–$603 could determine whether buyers have enough strength to continue the recovery.
Discussion Question:
Do you think BNB will break above $603 and move toward $610, or will sellers push it back below $590?
Share your analysis and let’s discuss the next possible move in $BNB .
Disclaimer: This article is for educational and informational purposes only. Cryptocurrency markets are highly volatile. These scenarios are not financial advice or guaranteed trading signals. Always conduct your own research and manage risk carefully.