
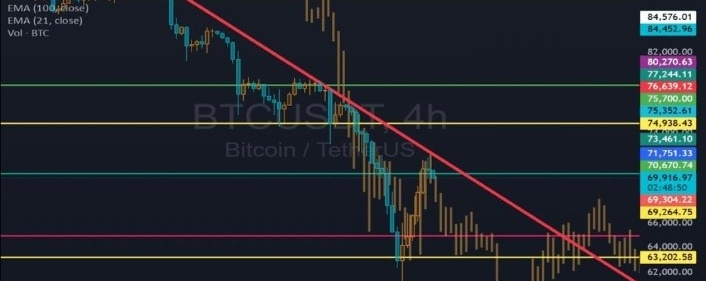

Bitcoin ($BTC ) is approaching a critical turning point. Market fear is increasing, institutional outflows are creating pressure, and futures traders are facing growing uncertainty. However, whale activity is also showing a few potentially positive signals.
The big question is: Can Bitcoin defend the $63,800 support zone, or are we about to see another significant decline?
Let's examine the market data, technical indicators, derivatives positioning, and on-chain activity to understand what could happen next.
1. Bitcoin Market Overview
According to the available market data for November 16, 2026, Bitcoin was trading around the $64,100–$64,300 area. Prices may vary depending on the time of observation.
Key market statistics:
Market Cap: Approximately $1.29 Trillion
Market Rank: #1
Circulating Supply: Approximately 20.11 Million BTC
Maximum Supply: 21 Million BTC
24H Price Change: Approximately -2%
BTC Dominance: Approximately 59.26%
Total Crypto Market Cap: Approximately $2.18 Trillion
Fear & Greed Index: 10 (Extreme Fear)
Market sentiment remains weak, with investors showing limited appetite for risk.
2. Technical Analysis: Sellers Still Have an Advantage
Looking at the 15-minute Binance chart, Bitcoin recently bounced after reaching a low of $63,905.
However, the EMA indicators have not yet confirmed a strong bullish reversal.
15M Chart Indicators:
EMA 9: $64,313.46
EMA 25: $64,403.04
RSI (6): 50.76
The EMA 9 remains below the EMA 25, indicating short-term weakness. Meanwhile, the RSI near 50 suggests that neither buyers nor sellers have established clear dominance.
The available 4-hour and daily chart analysis also indicates a bearish market structure.
This means the recent recovery should not yet be considered a confirmed trend reversal.
3. Important Support and Resistance Levels
These are the key price zones Bitcoin traders should monitor.
Support Zones:
$63,900–$63,800
$62,861
$62,006
$60,370
Resistance Zones:
$65,475
$65,831
$66,132
$66,987
$68,622
If BTC manages to close a strong 1-hour candle above $65,475 with increasing volume, the probability of a stronger recovery could improve.
However, if Bitcoin closes a 4-hour candle below $63,800, the risk of further downside could increase.
4. Futures Market: Are Long Traders in Danger?
The derivatives market is providing some important signals.
According to the available data:
BTC Open Interest: Approximately $24.6 Billion (aggregated market data)
24H Liquidations: $60.6 Million
Long Liquidations: $39.6 Million
Short Liquidations: $21 Million
Average Funding Rate: +0.0032% per 8 hours
Long liquidations are significantly higher than short liquidations, suggesting that the recent decline has affected bullish traders more heavily.
Additionally, approximately 73.7% of Binance BTC futures accounts were positioned Long in the referenced data.
If Bitcoin drops again, another Long Squeeze could occur.
5. Whale Activity: A Small Positive Signal
Bitcoin whale activity is showing an interesting development.
Available 24-hour whale exchange flow data:
Exchange Inflow: 7,329 BTC
Exchange Outflow: 8,608 BTC
Netflow: -1,279 BTC
More BTC reportedly moved out of exchanges than entered them.
This could indicate potential accumulation, as some large holders may be moving their Bitcoin into private storage.
However, exchange outflows do not automatically mean buying activity. Additional evidence is needed to confirm actual accumulation.
6. Bitcoin ETF: Institutional Pressure
Institutional capital flows remain an important factor in Bitcoin's market direction.
On November 13, 2026, US Spot Bitcoin ETFs reportedly recorded approximately $185.4 Million in net outflows.
If ETF outflows continue, institutional buying pressure could weaken further.
This remains an important bearish catalyst for Bitcoin in the short term.
7. Bullish vs. Bearish Outlook
Bullish Scenario
If Bitcoin successfully defends the $63,800–$63,900 support zone and breaks above $65,475 with strong volume, the following targets could become relevant:
$65,831 → $66,132 → $66,987
Beyond these levels, $68,622 becomes another important resistance area.
Bearish Scenario
If the $63,800 support breaks and the 4-hour candle closes below it, the following downside zones could become relevant:
$62,861 → $62,006 → $60,370
These are potential downside targets, not guaranteed price levels.
Both scenarios remain possible. A single green candle is not enough to confirm a trend reversal.
8. My Bitcoin Outlook for the Coming Days
For the next 24–48 hours, three possible scenarios stand out:
Bullish: $65,475–$66,132
Sideways: $63,800–$65,475
Bearish: $62,861–$62,006
Over the next seven days, ETF flows, BTC dominance, futures positioning, and the $63,800 support zone could play an important role in determining Bitcoin's direction.
My current short-term outlook is bearish, although Bitcoin's long-term fundamentals remain significant.
Final Thoughts
Bitcoin is currently moving through a period of fear and uncertainty.
On one side, ETF outflows, weak technical structure, and long liquidations are putting pressure on the market. On the other side, whale exchange outflows are providing a potentially positive signal.
In my view, the two most important levels to watch right now are $63,800 support and $65,475 resistance.
Whichever level Bitcoin decisively breaks could provide a clearer indication of its next short-term direction.
Finding opportunities in the market is important, but protecting capital is even more important.
What do you think?
Will Bitcoin recover toward $66,000 and start a bullish move, or will we see another decline toward $62,000?
Share your analysis in the comments.



Disclaimer: This article is for educational and informational purposes only. Cryptocurrency markets are highly volatile. All price levels are scenario-based estimates, not guaranteed outcomes or personalized financial advice.
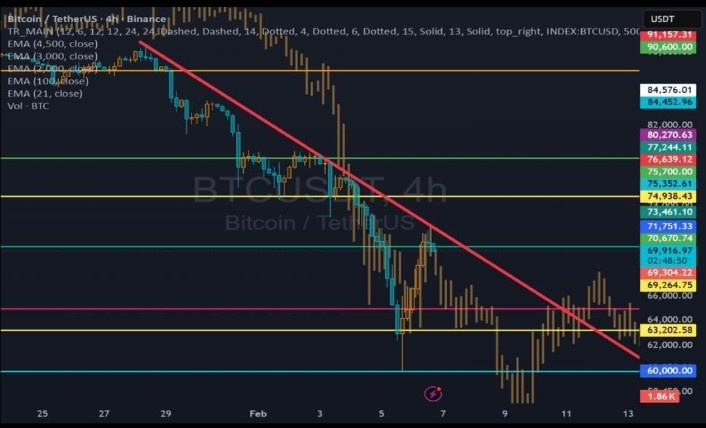
Market Data Reference: November 16, 2026.