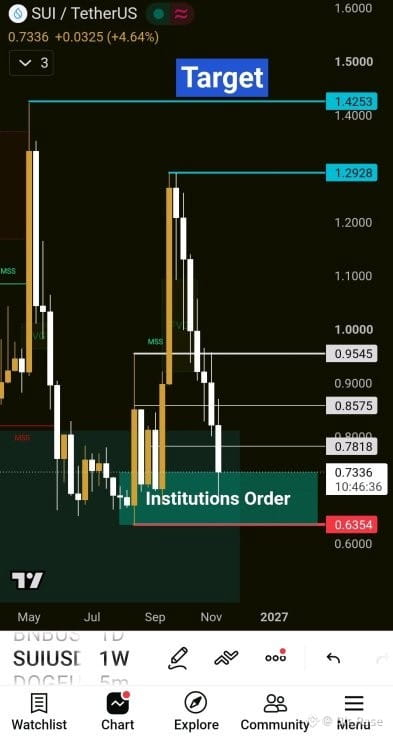

$SUI — After weeks of decline, the daily chart has set up an intriguing scenario. The last two daily candles nearly touched the same low around ~$0.676. On Nov 14, SUI plunged to about $0.6754 before recovering to close near $0.701. The Nov 15 candle (still forming) also dipped to ~$0.6759 and then bounced up toward $0.735. Two near-identical lows at this level caught my eye. This action is happening in a green zone I marked roughly between $0.6354 and $0.74. That zone is a major demand area on the higher timeframe. The clear reaction around here hints that selling pressure may be subsiding. But I stress: this is a test of demand, not a confirmed bottom. What makes the setup more interesting is the weekly context. SUI has returned to a significant historical support region after a long drop. If buyers can defend this area, the potential upside could be substantial. For now, any rally would likely face key resistance around $0.78, then $0.8575, and then $0.9545. These are hurdles a sustained recovery must overcome. Only by clearing those convincingly would we start challenging the higher weekly targets near $1.2928 and $1.4253. Risk Management I'm treating the ~$0.675 area as a warning level. A sustained break below it would suggest this bounce is failing. The ultimate invalidation is a drop below ~$0.6354 on the weekly chart. I don't have an active entry or stop right now. If I take a position, it would require a tight stop and careful sizing, since the daily trend is still downward. In summary, this SUI setup has caught my attention for its clear test of demand at a key level. I'm preparing for a possible reversal, but I'll wait for follow-through before committing. A real recovery would need to hold this zone and clear the resistances mentioned above; until then, patience is essential.
$SUI
$SUI