$BNB Update: Testing the $600 Ceiling, Bulls Show Strength After a V-Shaped Recovery 🟡
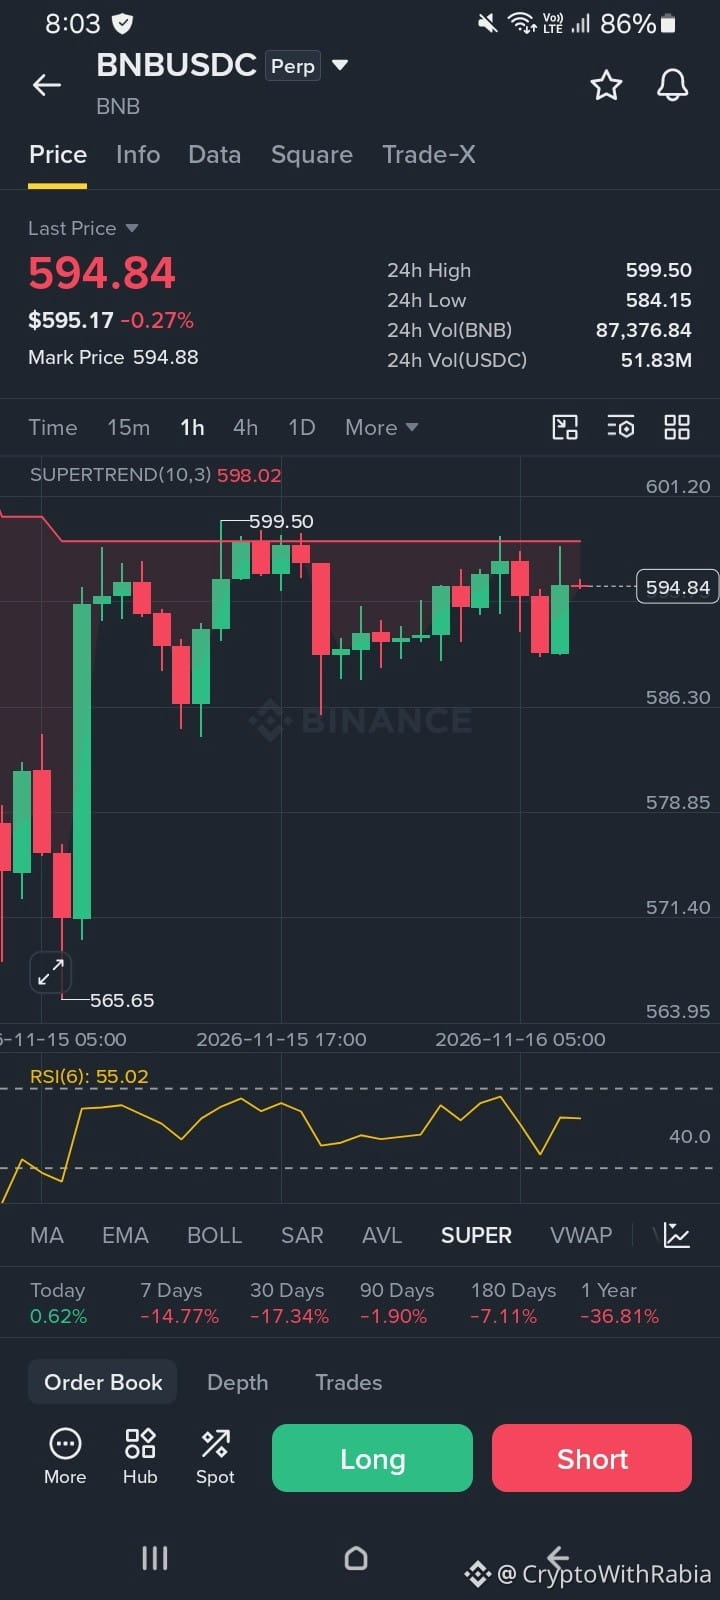
BNB (BNBUSDC Perp) is trading around $594.84, down -0.27% in the last 24 hours. The 24h range is $584.15 to $599.50, with volume of about $51.83M USDC.
Short-term view (1h chart):
• Price bounced sharply from the $565.65 low and is now pressing against the $599.50 resistance
• Supertrend is bearish at $598.02, sitting right above price as the level to beat
• RSI(6) is at 55.0, neutral to mildly bullish with room to move up
• Resistance: $598.02, then $599.50 and $601.20
• Support: $586.30, then $578.85 and $565.65
Bigger picture:
• Today: +0.62%
• 7 Days: -14.77%
• 30 Days: -17.34%
• 90 Days: -1.90%
• 180 Days: -7.11%
• 1 Year: -36.81%
BNB held up better than most of the market during the recent sell-off, and the strong recovery candle shows buyers are active. Price is now stuck under a flat resistance zone near $599 to $600. A clean break and hold above it would flip the short-term trend bullish, while a rejection can send price back toward the $586 support.
📊 Trade Plan (Example Only):
Long (breakout play):
• Entry: Above $600 with a 1h candle close (Supertrend flip)
• Stop Loss: $592
• TP1: $610
• TP2: $620
• Risk-Reward: approx. 1:2
Long (pullback entry):
• Entry: $586 - $590 (confirm with a green 1h candle)
• Stop Loss: $580
• TP1: $598
• TP2: $600
Short (rejection play):
• Entry: Rejection near $598 to $600 with a bearish 1h candle
• Stop Loss: $603
• TP1: $586
• TP2: $578
Invalidation: For the breakout, a close back below $592 means the move failed. For the pullback long, a close below $578 cancels the setup. For shorts, a strong 1h close above $601 invalidates the rejection.
Wait for candle closes, keep position size small, and use low leverage on futures.
Will BNB break $600 or get rejected again? Share your view below! 👇
Not financial advice. Always DYOR. Futures trading carries high risk.
#bnb #cryptotrading #TradingSignals #TechnicalAnalysis #BinanceSquare
BNB (BNBUSDC Perp) is trading around $594.84, down -0.27% in the last 24 hours. The 24h range is $584.15 to $599.50, with volume of about $51.83M USDC.
Short-term view (1h chart):
• Price bounced sharply from the $565.65 low and is now pressing against the $599.50 resistance
• Supertrend is bearish at $598.02, sitting right above price as the level to beat
• RSI(6) is at 55.0, neutral to mildly bullish with room to move up
• Resistance: $598.02, then $599.50 and $601.20
• Support: $586.30, then $578.85 and $565.65
Bigger picture:
• Today: +0.62%
• 7 Days: -14.77%
• 30 Days: -17.34%
• 90 Days: -1.90%
• 180 Days: -7.11%
• 1 Year: -36.81%
BNB held up better than most of the market during the recent sell-off, and the strong recovery candle shows buyers are active. Price is now stuck under a flat resistance zone near $599 to $600. A clean break and hold above it would flip the short-term trend bullish, while a rejection can send price back toward the $586 support.
📊 Trade Plan (Example Only):
Long (breakout play):
• Entry: Above $600 with a 1h candle close (Supertrend flip)
• Stop Loss: $592
• TP1: $610
• TP2: $620
• Risk-Reward: approx. 1:2
Long (pullback entry):
• Entry: $586 - $590 (confirm with a green 1h candle)
• Stop Loss: $580
• TP1: $598
• TP2: $600
Short (rejection play):
• Entry: Rejection near $598 to $600 with a bearish 1h candle
• Stop Loss: $603
• TP1: $586
• TP2: $578
Invalidation: For the breakout, a close back below $592 means the move failed. For the pullback long, a close below $578 cancels the setup. For shorts, a strong 1h close above $601 invalidates the rejection.
Wait for candle closes, keep position size small, and use low leverage on futures.
Will BNB break $600 or get rejected again? Share your view below! 👇
Not financial advice. Always DYOR. Futures trading carries high risk.
#bnb #cryptotrading #TradingSignals #TechnicalAnalysis #BinanceSquare