
B15B
530 Публикации

B15B
Отправить жалобу
Заблокировать пользователя
Assets & market analysis , news impact , events impact .
0 подписок(и/а)
8 подписчиков(а)
148 понравилось
Посты
Все
Цитирования
·
--
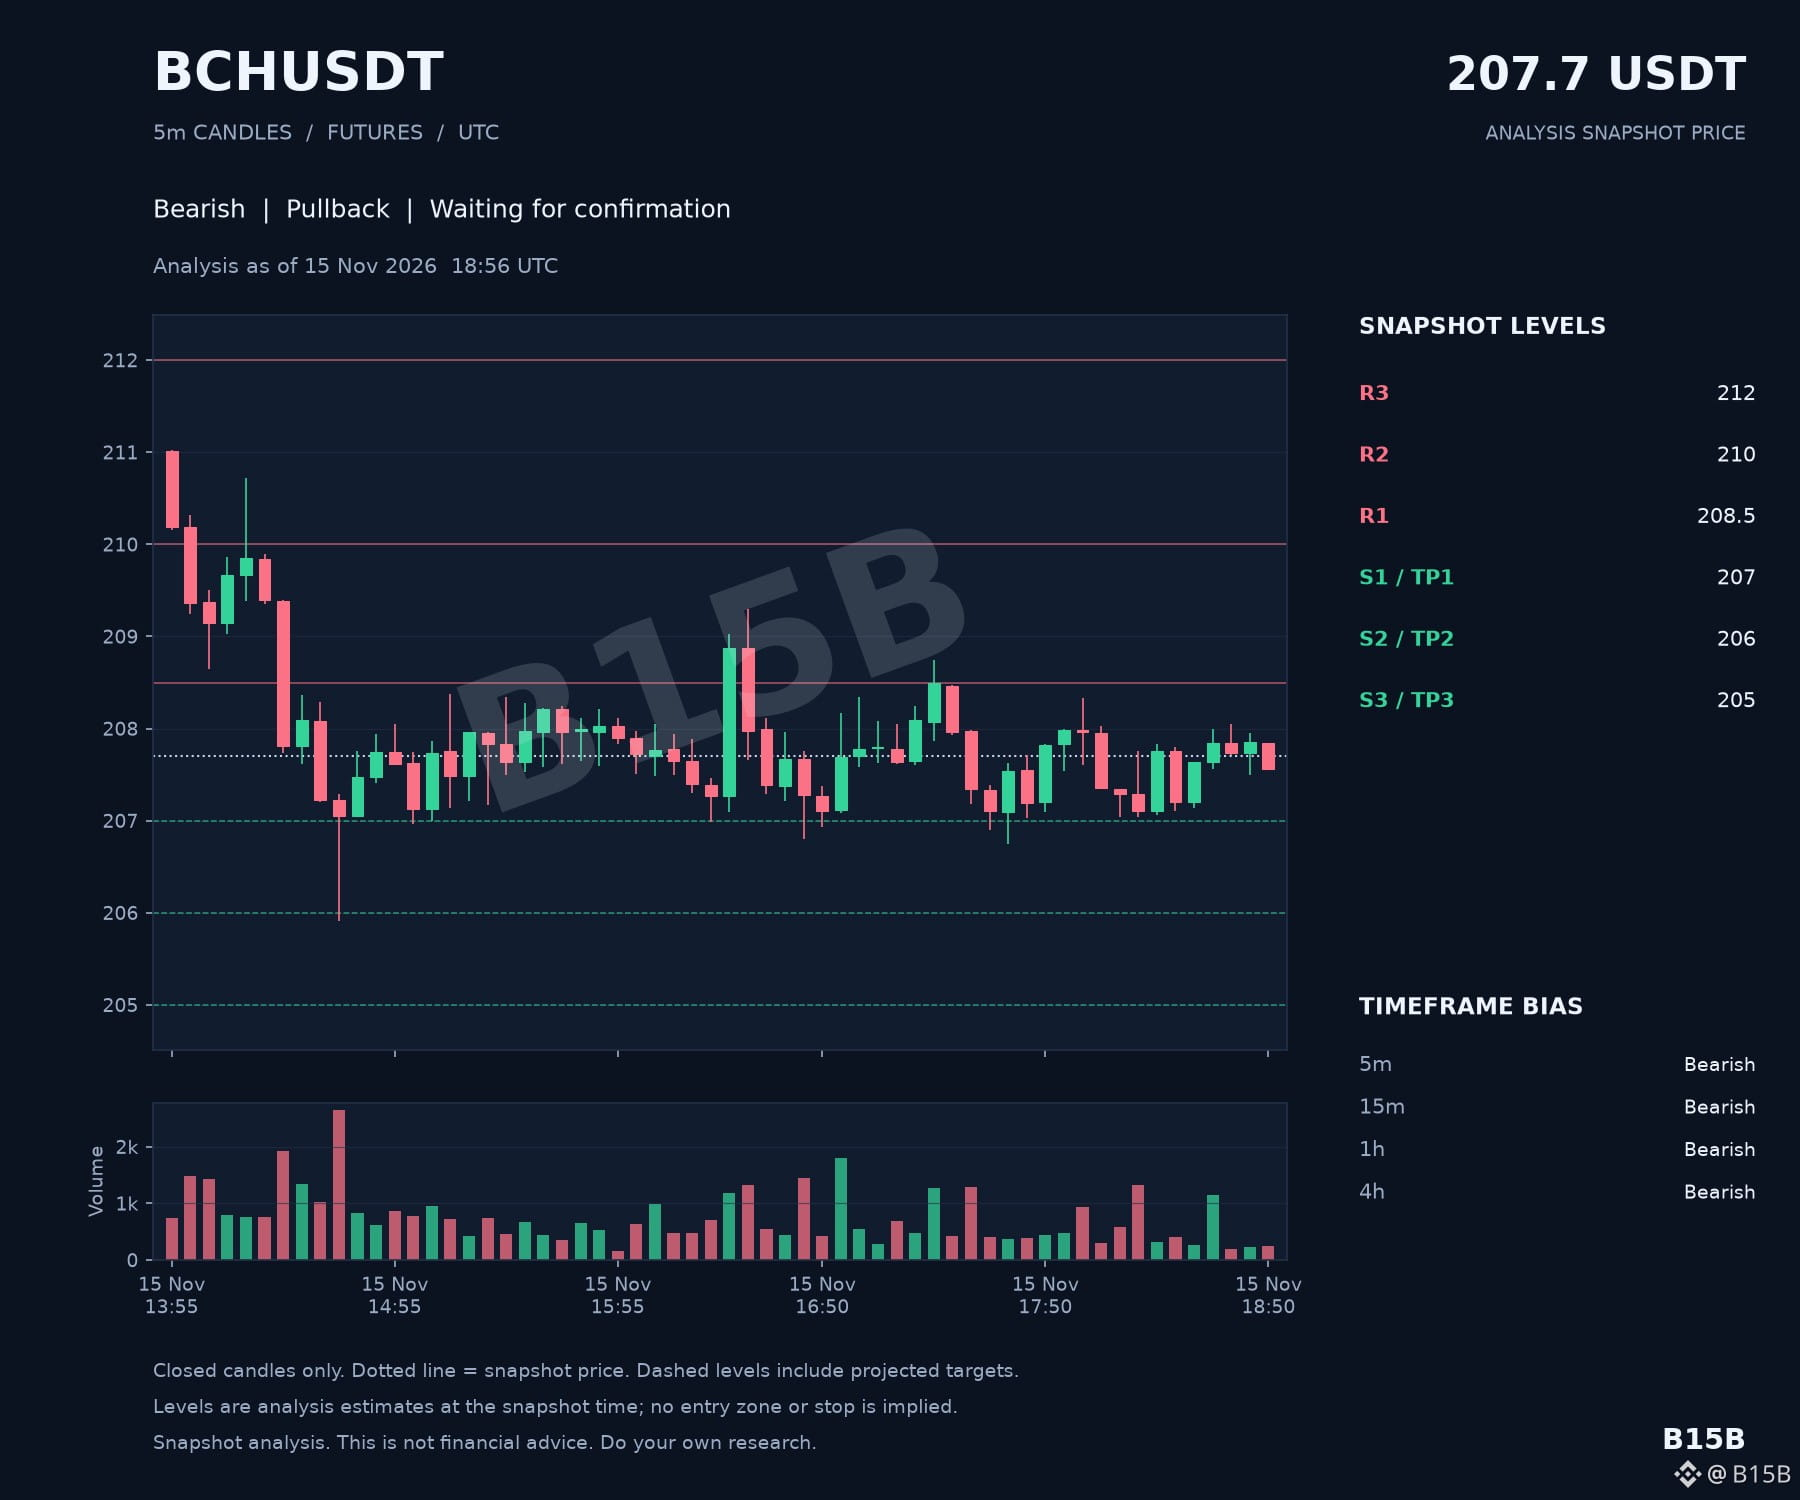
$BCH is testing buyer resolve at 207.7. It is rare to see such a clean sweep of bearish sentiment across every timeframe from the 5m to the 4h, suggesting a heavy wait-and-see mode 🔍. While we are tracking a pullback setup, resistance at 208.5 🚧 remains a significant hurdle.
With every single timeframe currently aligned in a bearish direction, what specific change in candle structure at the 207 support ⚓ would you need to see before feeling confident a floor has finally formed?
#BCH #Crypto #Trading #TechnicalAnalysis
$BCH is testing buyer resolve at 207.7. It is rare to see such a clean sweep of bearish sentiment across every timeframe from the 5m to the 4h, suggesting a heavy wait-and-see mode 🔍. While we are tracking a pullback setup, resistance at 208.5 🚧 remains a significant hurdle.
With every single timeframe currently aligned in a bearish direction, what specific change in candle structure at the 207 support ⚓ would you need to see before feeling confident a floor has finally formed?
#BCH #Crypto #Trading #TechnicalAnalysis
With every single timeframe currently aligned in a bearish direction, what specific change in candle structure at the 207 support ⚓ would you need to see before feeling confident a floor has finally formed?
#BCH #Crypto #Trading #TechnicalAnalysis
6
·
--
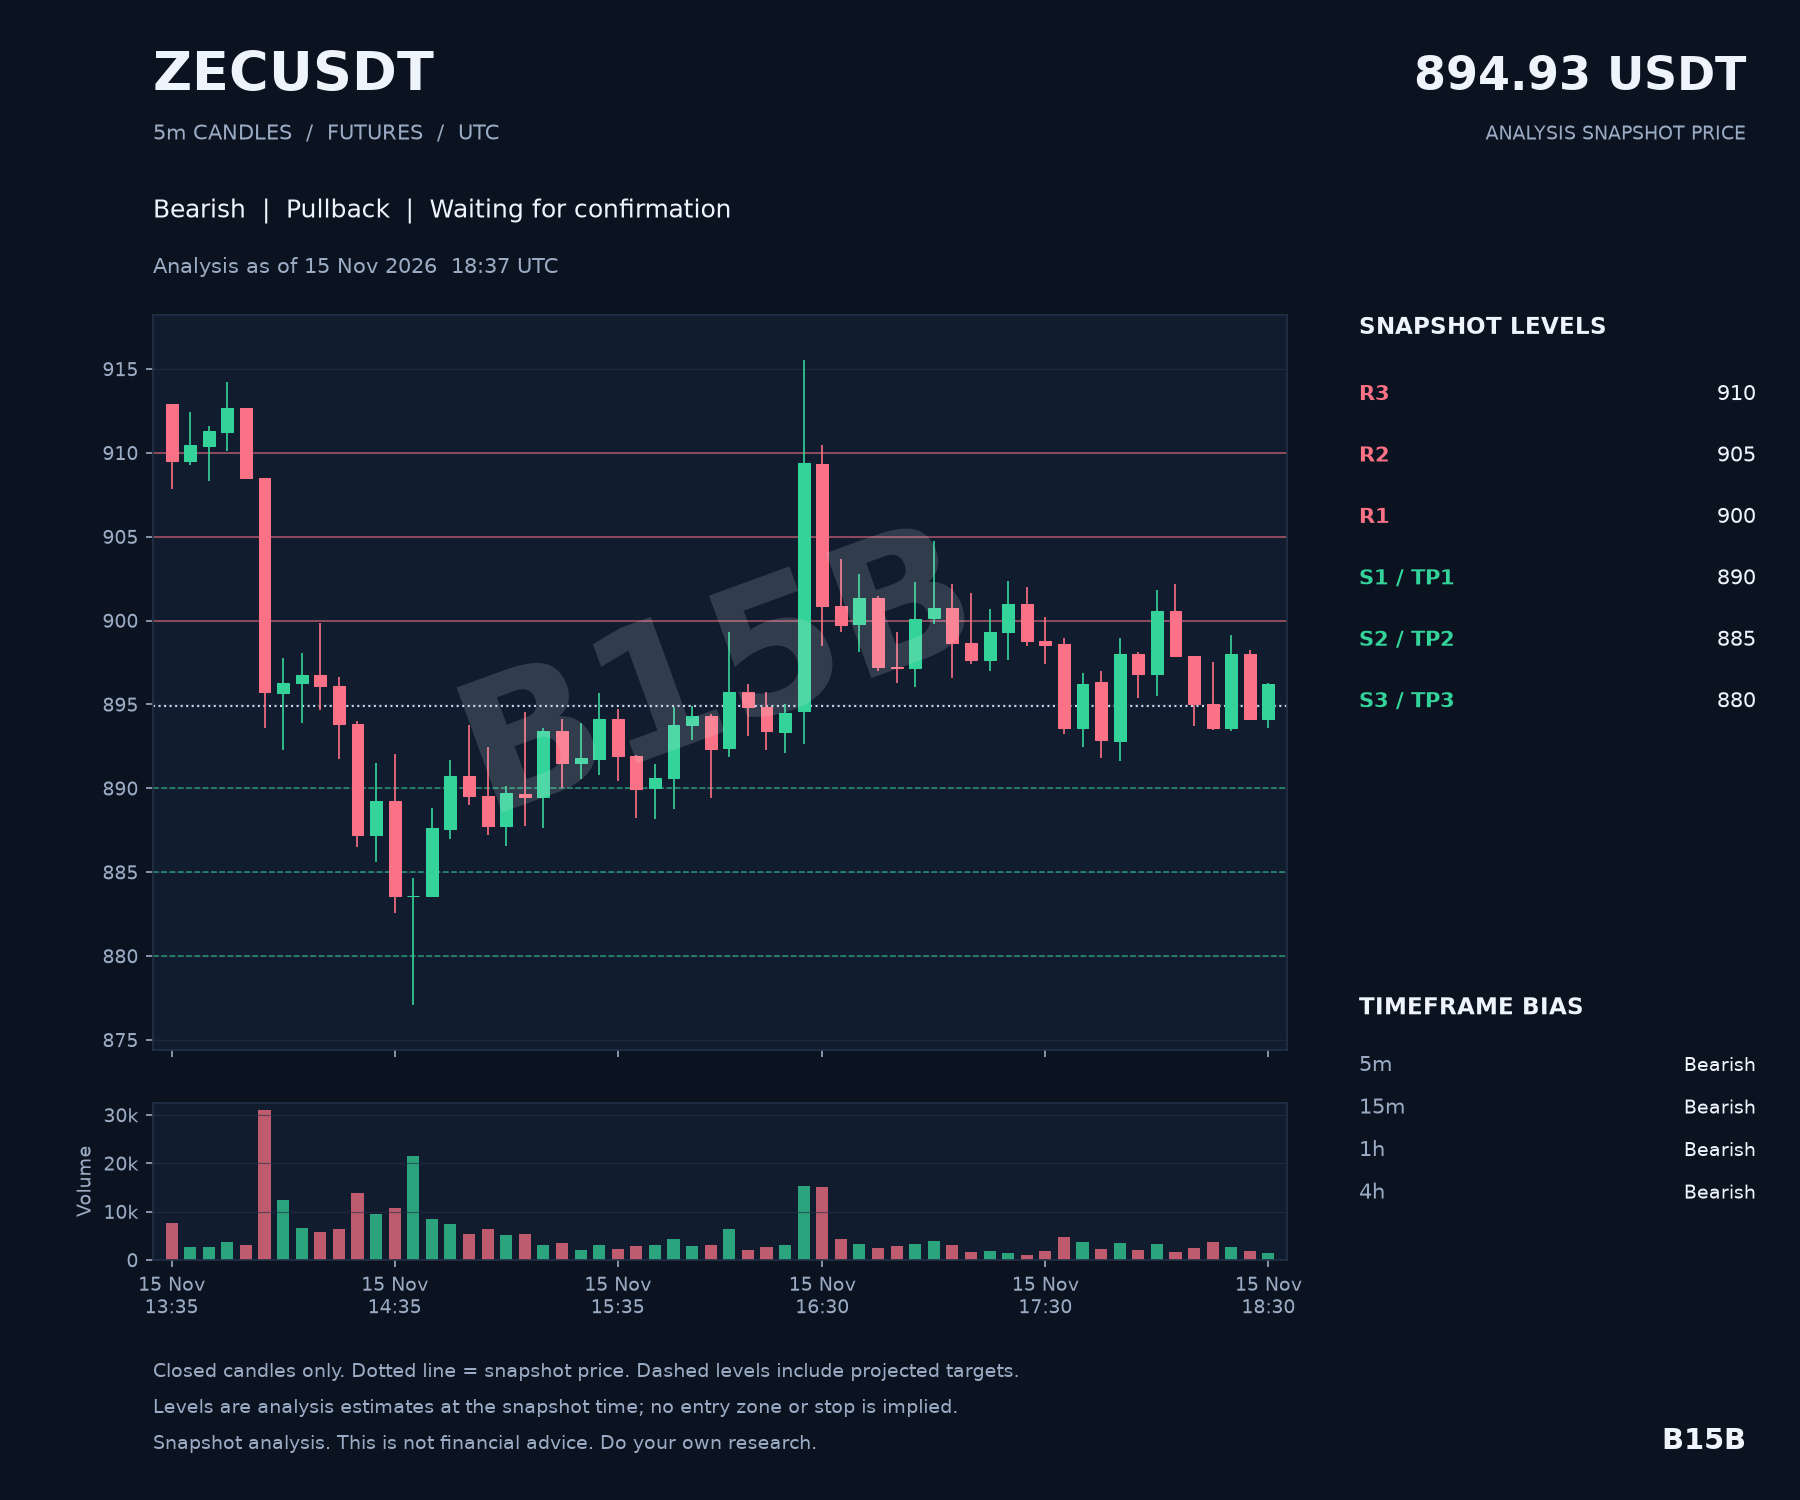
$ZEC is currently navigating a very heavy technical landscape. It is rare to see such a unified front of bearish sentiment, but the data is undeniable: every single timeframe, from the 5-minute micro-view to the 4-hour trend, is in total bearish synchronization.
The current setup is classified as a pullback, yet it is important to note that entry confirmation remains pending. Price is hovering just above the immediate support at $890, with further downside targets identified at $885 and $880 should the current momentum persist. On the flip side, the path higher is cluttered with resistance levels starting at $900 and stretching up to $910, creating a significant overhead ceiling for any attempted recovery.
With every timeframe from the 5-minute to the 4-hour currently locked in a bearish trend, how do you interpret the total lack of bullish divergence as $ZEC approaches the $890 support?
The market is clearly leaning into this downward pressure, but without a confirmed entry trigger, the situation remains one of observation. The lack of any timeframe disagreement suggests that the sellers are firmly in control of the narrative for the time being.
#ZEC #Zcash #CryptoAnalysis #TechnicalAnalysis
$ZEC is currently navigating a very heavy technical landscape. It is rare to see such a unified front of bearish sentiment, but the data is undeniable: every single timeframe, from the 5-minute micro-view to the 4-hour trend, is in total bearish synchronization.
The current setup is classified as a pullback, yet it is important to note that entry confirmation remains pending. Price is hovering just above the immediate support at $890, with further downside targets identified at $885 and $880 should the current momentum persist. On the flip side, the path higher is cluttered with resistance levels starting at $900 and stretching up to $910, creating a significant overhead ceiling for any attempted recovery.
With every timeframe from the 5-minute to the 4-hour currently locked in a bearish trend, how do you interpret the total lack of bullish divergence as $ZEC approaches the $890 support?
The market is clearly leaning into this downward pressure, but without a confirmed entry trigger, the situation remains one of observation. The lack of any timeframe disagreement suggests that the sellers are firmly in control of the narrative for the time being.
#ZEC #Zcash #CryptoAnalysis #TechnicalAnalysis
The current setup is classified as a pullback, yet it is important to note that entry confirmation remains pending. Price is hovering just above the immediate support at $890, with further downside targets identified at $885 and $880 should the current momentum persist. On the flip side, the path higher is cluttered with resistance levels starting at $900 and stretching up to $910, creating a significant overhead ceiling for any attempted recovery.
With every timeframe from the 5-minute to the 4-hour currently locked in a bearish trend, how do you interpret the total lack of bullish divergence as $ZEC approaches the $890 support?
The market is clearly leaning into this downward pressure, but without a confirmed entry trigger, the situation remains one of observation. The lack of any timeframe disagreement suggests that the sellers are firmly in control of the narrative for the time being.
#ZEC #Zcash #CryptoAnalysis #TechnicalAnalysis
140
·
--
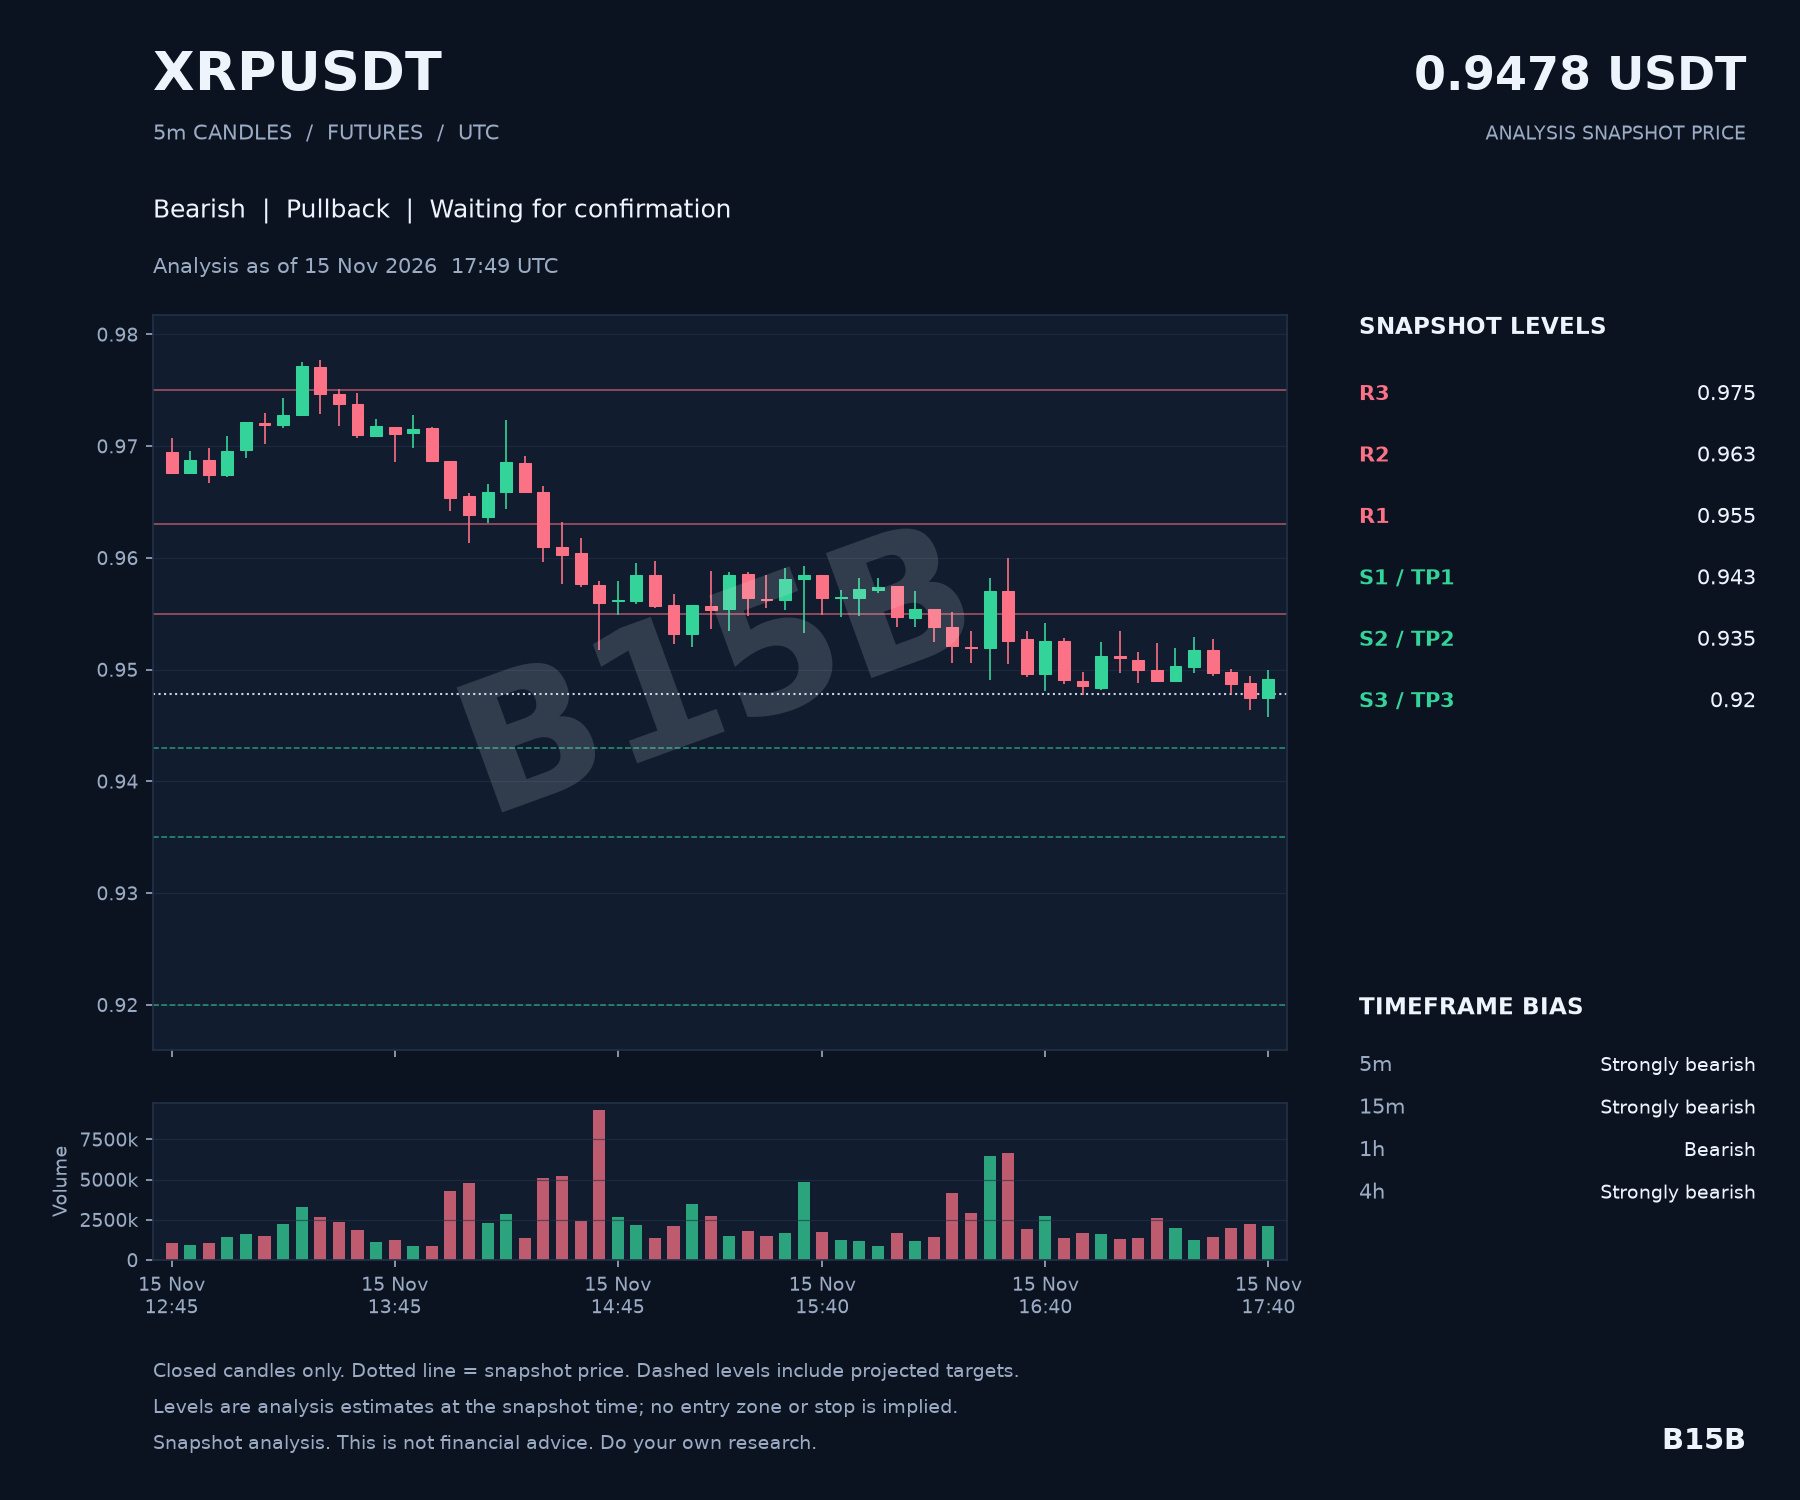
$XRP is currently navigating a period of significant technical synchronization, but not the kind buyers usually look for. It is rare to see a total sweep where the 5-minute, 15-minute, 1-hour, and 4-hour timeframes are all in total agreement, yet right now, every single one of them is signaling a bearish or strongly bearish trend.
At a current price of $0.9478, the market is hovering just above the immediate support level of $0.943. While the official setup is a pullback, the weight of the data suggests this is a high-pressure environment. If that $0.943 floor doesn't provide a meaningful bounce, the technical path points toward lower targets at $0.935 and potentially $0.92.
On the flip side, any attempt at a recovery faces a series of hurdles, starting with resistance at $0.955 and $0.963. Given that entry confirmation is still pending, the chart is essentially asking for patience until the bears exhaust their current momentum.
With every timeframe from the 5m micro-view to the 4h trend currently aligned in a bearish direction, what specific shift in candle structure or price behavior at the $0.943 support would you need to see to believe the selling pressure is actually neutralizing?
#XRP #TechnicalAnalysis #CryptoMarket
$XRP is currently navigating a period of significant technical synchronization, but not the kind buyers usually look for. It is rare to see a total sweep where the 5-minute, 15-minute, 1-hour, and 4-hour timeframes are all in total agreement, yet right now, every single one of them is signaling a bearish or strongly bearish trend.
At a current price of $0.9478, the market is hovering just above the immediate support level of $0.943. While the official setup is a pullback, the weight of the data suggests this is a high-pressure environment. If that $0.943 floor doesn't provide a meaningful bounce, the technical path points toward lower targets at $0.935 and potentially $0.92.
On the flip side, any attempt at a recovery faces a series of hurdles, starting with resistance at $0.955 and $0.963. Given that entry confirmation is still pending, the chart is essentially asking for patience until the bears exhaust their current momentum.
With every timeframe from the 5m micro-view to the 4h trend currently aligned in a bearish direction, what specific shift in candle structure or price behavior at the $0.943 support would you need to see to believe the selling pressure is actually neutralizing?
#XRP #TechnicalAnalysis #CryptoMarket
At a current price of $0.9478, the market is hovering just above the immediate support level of $0.943. While the official setup is a pullback, the weight of the data suggests this is a high-pressure environment. If that $0.943 floor doesn't provide a meaningful bounce, the technical path points toward lower targets at $0.935 and potentially $0.92.
On the flip side, any attempt at a recovery faces a series of hurdles, starting with resistance at $0.955 and $0.963. Given that entry confirmation is still pending, the chart is essentially asking for patience until the bears exhaust their current momentum.
With every timeframe from the 5m micro-view to the 4h trend currently aligned in a bearish direction, what specific shift in candle structure or price behavior at the $0.943 support would you need to see to believe the selling pressure is actually neutralizing?
#XRP #TechnicalAnalysis #CryptoMarket
47
·
--
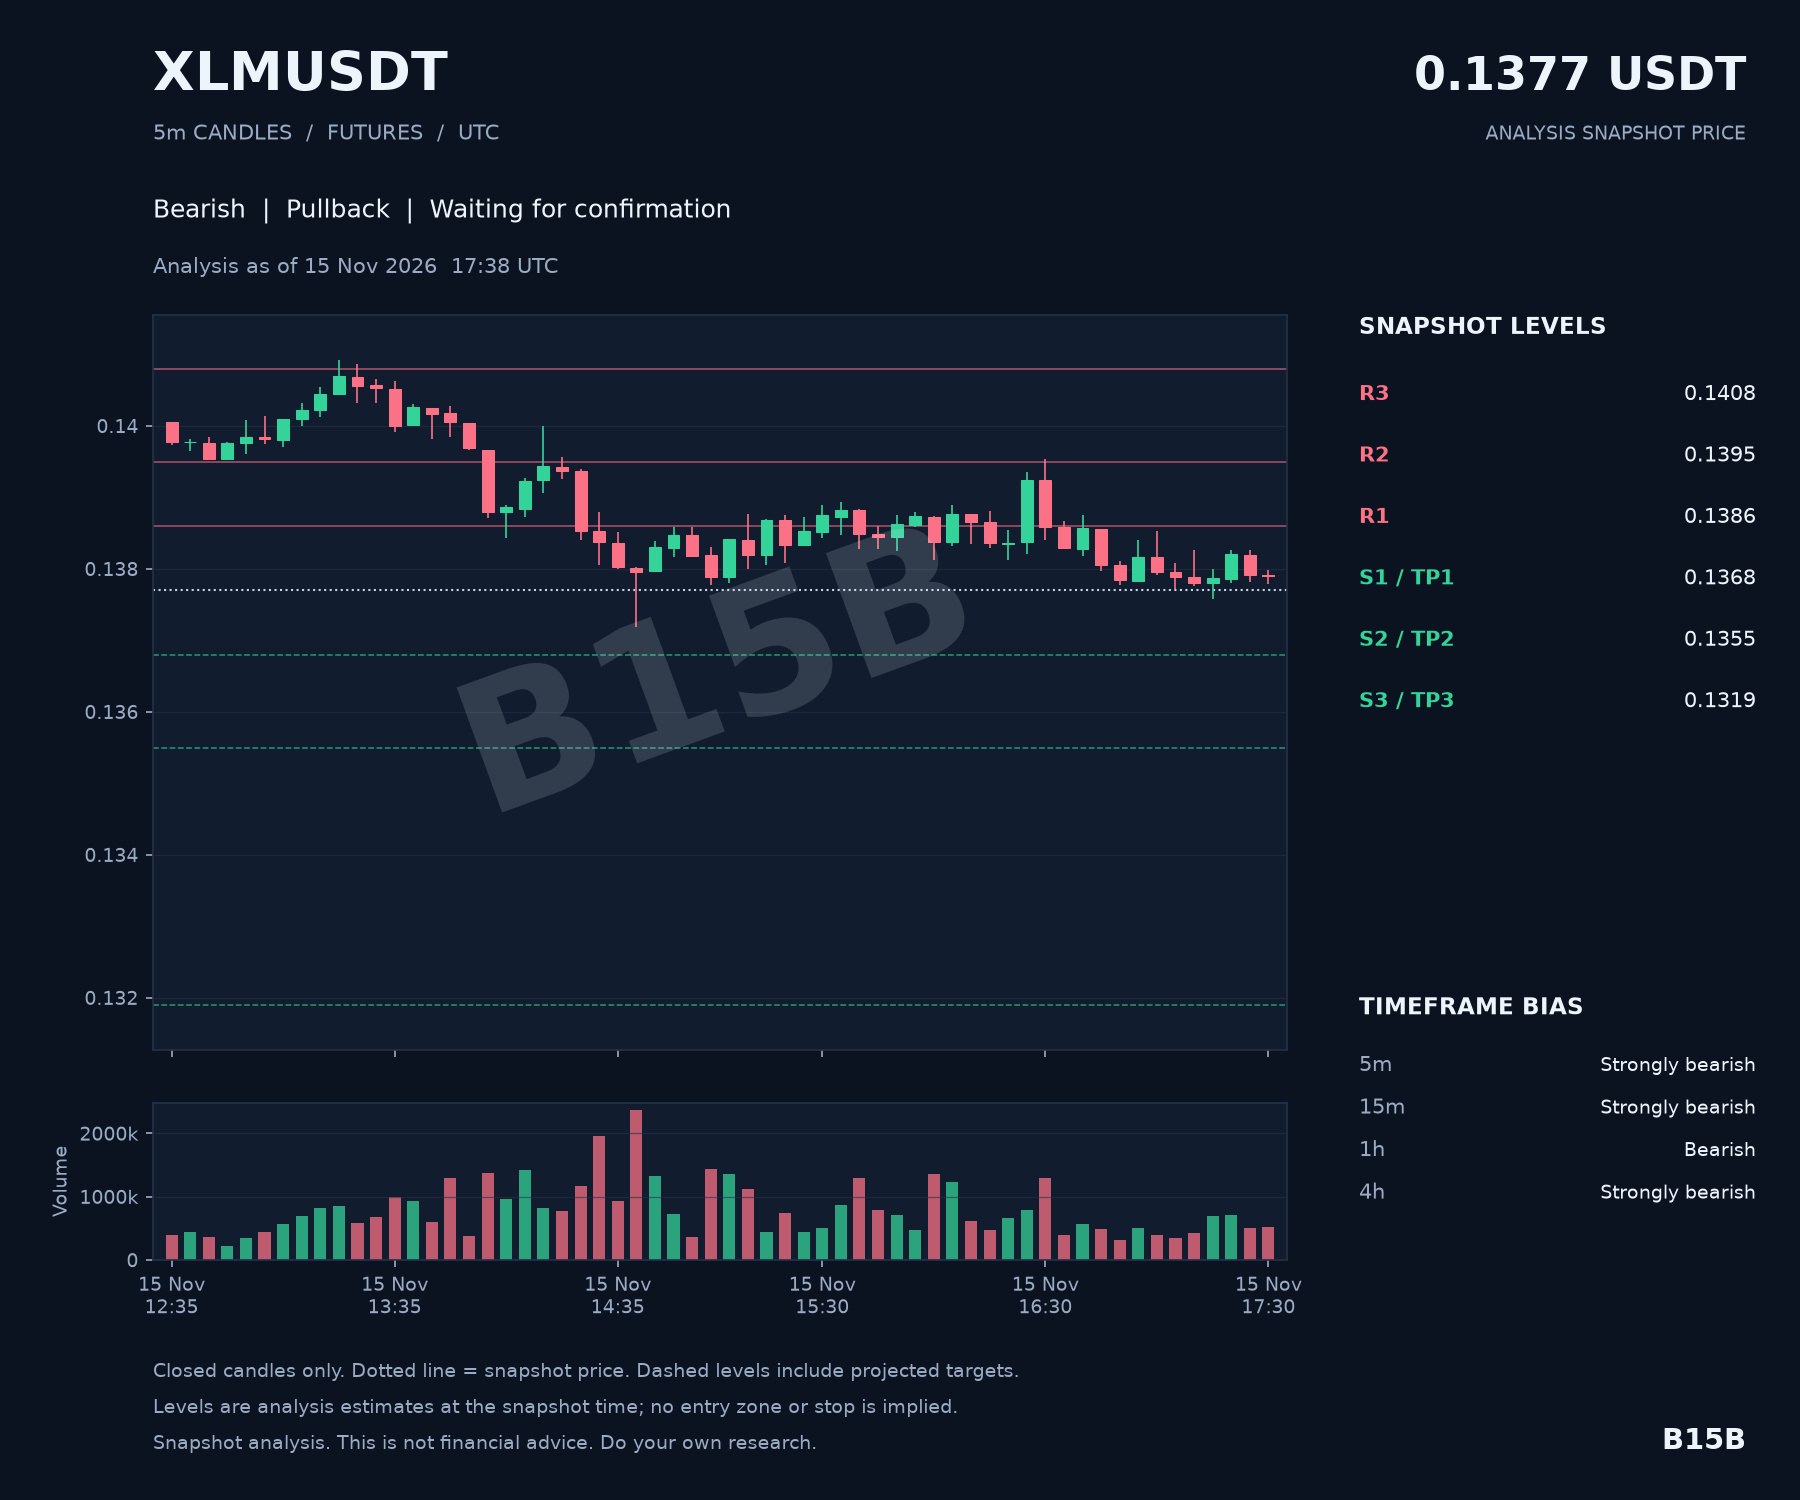
$XLM is facing a very heavy technical ceiling right now. It is rare to see such a clean sweep of bearish sentiment across the entire board, but the data is currently undeniable: every timeframe from the 5-minute micro-scalp view all the way up to the 4-hour trend is flashing red.
With the price sitting at 0.1377, we are hovering just above the immediate support at 0.1368. While the setup is technically a pullback, there isn't much room for the bulls to breathe. Resistance is stacked closely overhead starting at 0.1386, suggesting that any minor relief rallies are likely to meet aggressive selling pressure before they can even gain momentum.
The fact that the 4-hour trend is "Strongly Bearish" while the 5-minute and 15-minute timeframes show the same intensity is a significant signal of momentum alignment. Given that every timeframe from the micro to the macro is currently in total bearish synchronization, what specific shift in candle behavior at the 0.1368 support would you need to see to believe a floor is actually forming, rather than just a temporary pause before the next leg down?
We are still waiting for entry confirmation, as the market seems to be deciding whether it wants to respect these immediate levels or push deeper toward the 0.1355 and 0.1319 targets.
#XLM #Stellar #CryptoAnalysis #TechnicalAnalysis
$XLM is facing a very heavy technical ceiling right now. It is rare to see such a clean sweep of bearish sentiment across the entire board, but the data is currently undeniable: every timeframe from the 5-minute micro-scalp view all the way up to the 4-hour trend is flashing red.
With the price sitting at 0.1377, we are hovering just above the immediate support at 0.1368. While the setup is technically a pullback, there isn't much room for the bulls to breathe. Resistance is stacked closely overhead starting at 0.1386, suggesting that any minor relief rallies are likely to meet aggressive selling pressure before they can even gain momentum.
The fact that the 4-hour trend is "Strongly Bearish" while the 5-minute and 15-minute timeframes show the same intensity is a significant signal of momentum alignment. Given that every timeframe from the micro to the macro is currently in total bearish synchronization, what specific shift in candle behavior at the 0.1368 support would you need to see to believe a floor is actually forming, rather than just a temporary pause before the next leg down?
We are still waiting for entry confirmation, as the market seems to be deciding whether it wants to respect these immediate levels or push deeper toward the 0.1355 and 0.1319 targets.
#XLM #Stellar #CryptoAnalysis #TechnicalAnalysis
With the price sitting at 0.1377, we are hovering just above the immediate support at 0.1368. While the setup is technically a pullback, there isn't much room for the bulls to breathe. Resistance is stacked closely overhead starting at 0.1386, suggesting that any minor relief rallies are likely to meet aggressive selling pressure before they can even gain momentum.
The fact that the 4-hour trend is "Strongly Bearish" while the 5-minute and 15-minute timeframes show the same intensity is a significant signal of momentum alignment. Given that every timeframe from the micro to the macro is currently in total bearish synchronization, what specific shift in candle behavior at the 0.1368 support would you need to see to believe a floor is actually forming, rather than just a temporary pause before the next leg down?
We are still waiting for entry confirmation, as the market seems to be deciding whether it wants to respect these immediate levels or push deeper toward the 0.1355 and 0.1319 targets.
#XLM #Stellar #CryptoAnalysis #TechnicalAnalysis
36
·
--
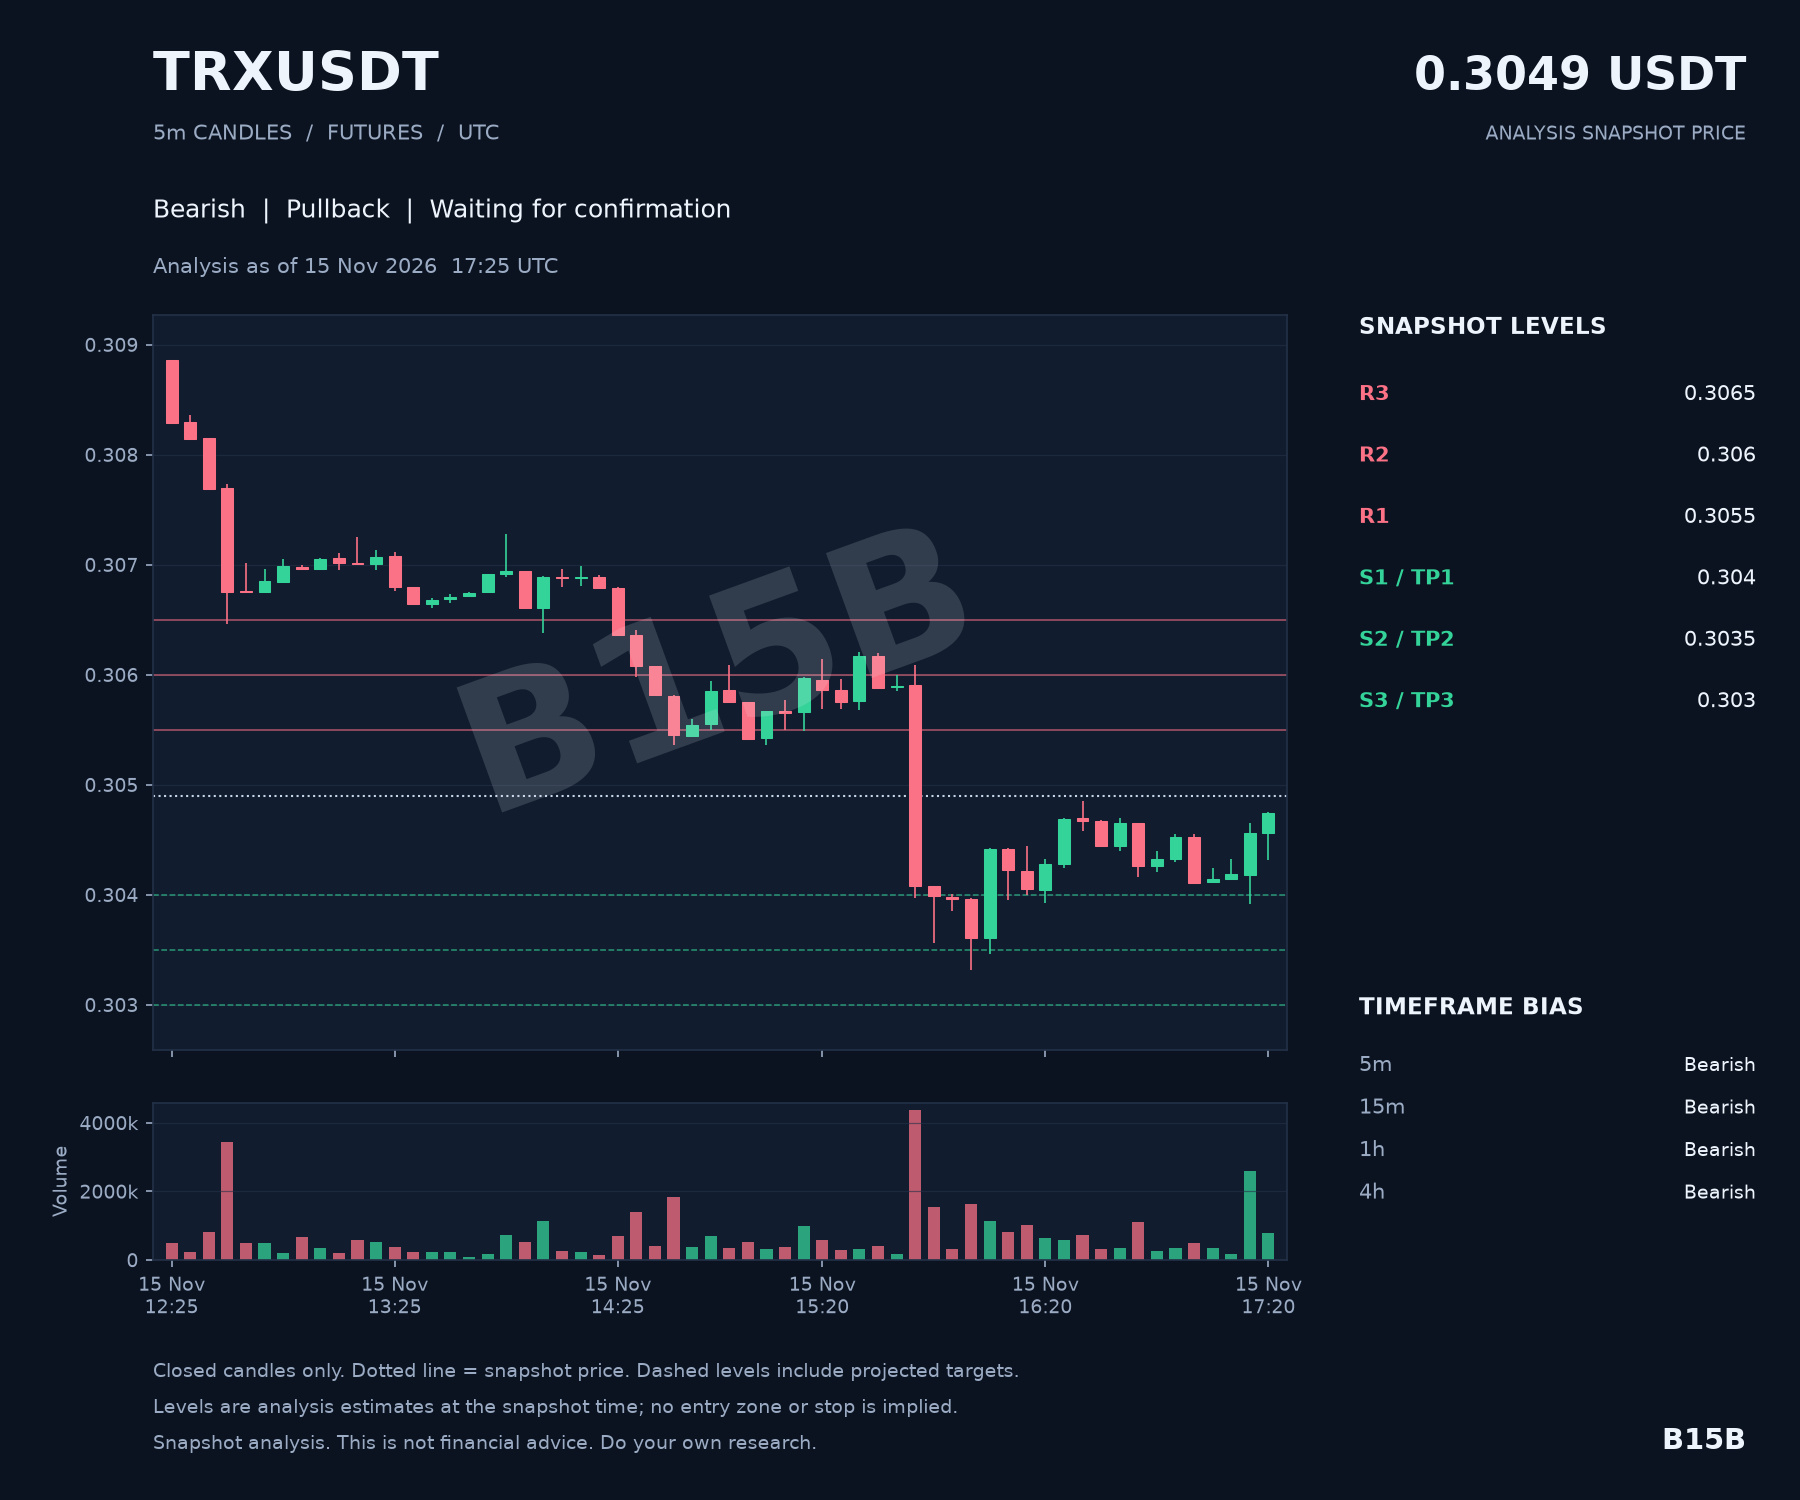
$TRX is currently navigating a very heavy technical landscape. It is rare to see such a unified front of bearish sentiment, but the data is clear: every single timeframe from the 5-minute micro-view up to the 4-hour trend is currently aligned in a bearish direction.
We are looking at a pullback setup here, though it is important to note that entry confirmation is still pending. At the current price of 0.3049, the market is hovering just above the immediate support level of 0.304. If the bears maintain this control, the structure suggests a potential move toward lower targets at 0.3035 and 0.303.
On the overhead side, any attempt at a recovery will likely face immediate friction. Resistance is sitting closely at 0.3055 and 0.306, which may act as a ceiling for any short-term relief bounces.
When you see a chart where the 4-hour trend and the 5-minute momentum are in total bearish synchronization like this, what specific shift in candle behavior would you need to see at the 0.304 support to convince you that the immediate downside pressure is exhausting?
#TRX #TRON #Crypto #TechnicalAnalysis
$TRX is currently navigating a very heavy technical landscape. It is rare to see such a unified front of bearish sentiment, but the data is clear: every single timeframe from the 5-minute micro-view up to the 4-hour trend is currently aligned in a bearish direction.
We are looking at a pullback setup here, though it is important to note that entry confirmation is still pending. At the current price of 0.3049, the market is hovering just above the immediate support level of 0.304. If the bears maintain this control, the structure suggests a potential move toward lower targets at 0.3035 and 0.303.
On the overhead side, any attempt at a recovery will likely face immediate friction. Resistance is sitting closely at 0.3055 and 0.306, which may act as a ceiling for any short-term relief bounces.
When you see a chart where the 4-hour trend and the 5-minute momentum are in total bearish synchronization like this, what specific shift in candle behavior would you need to see at the 0.304 support to convince you that the immediate downside pressure is exhausting?
#TRX #TRON #Crypto #TechnicalAnalysis
We are looking at a pullback setup here, though it is important to note that entry confirmation is still pending. At the current price of 0.3049, the market is hovering just above the immediate support level of 0.304. If the bears maintain this control, the structure suggests a potential move toward lower targets at 0.3035 and 0.303.
On the overhead side, any attempt at a recovery will likely face immediate friction. Resistance is sitting closely at 0.3055 and 0.306, which may act as a ceiling for any short-term relief bounces.
When you see a chart where the 4-hour trend and the 5-minute momentum are in total bearish synchronization like this, what specific shift in candle behavior would you need to see at the 0.304 support to convince you that the immediate downside pressure is exhausting?
#TRX #TRON #Crypto #TechnicalAnalysis
16
·
--
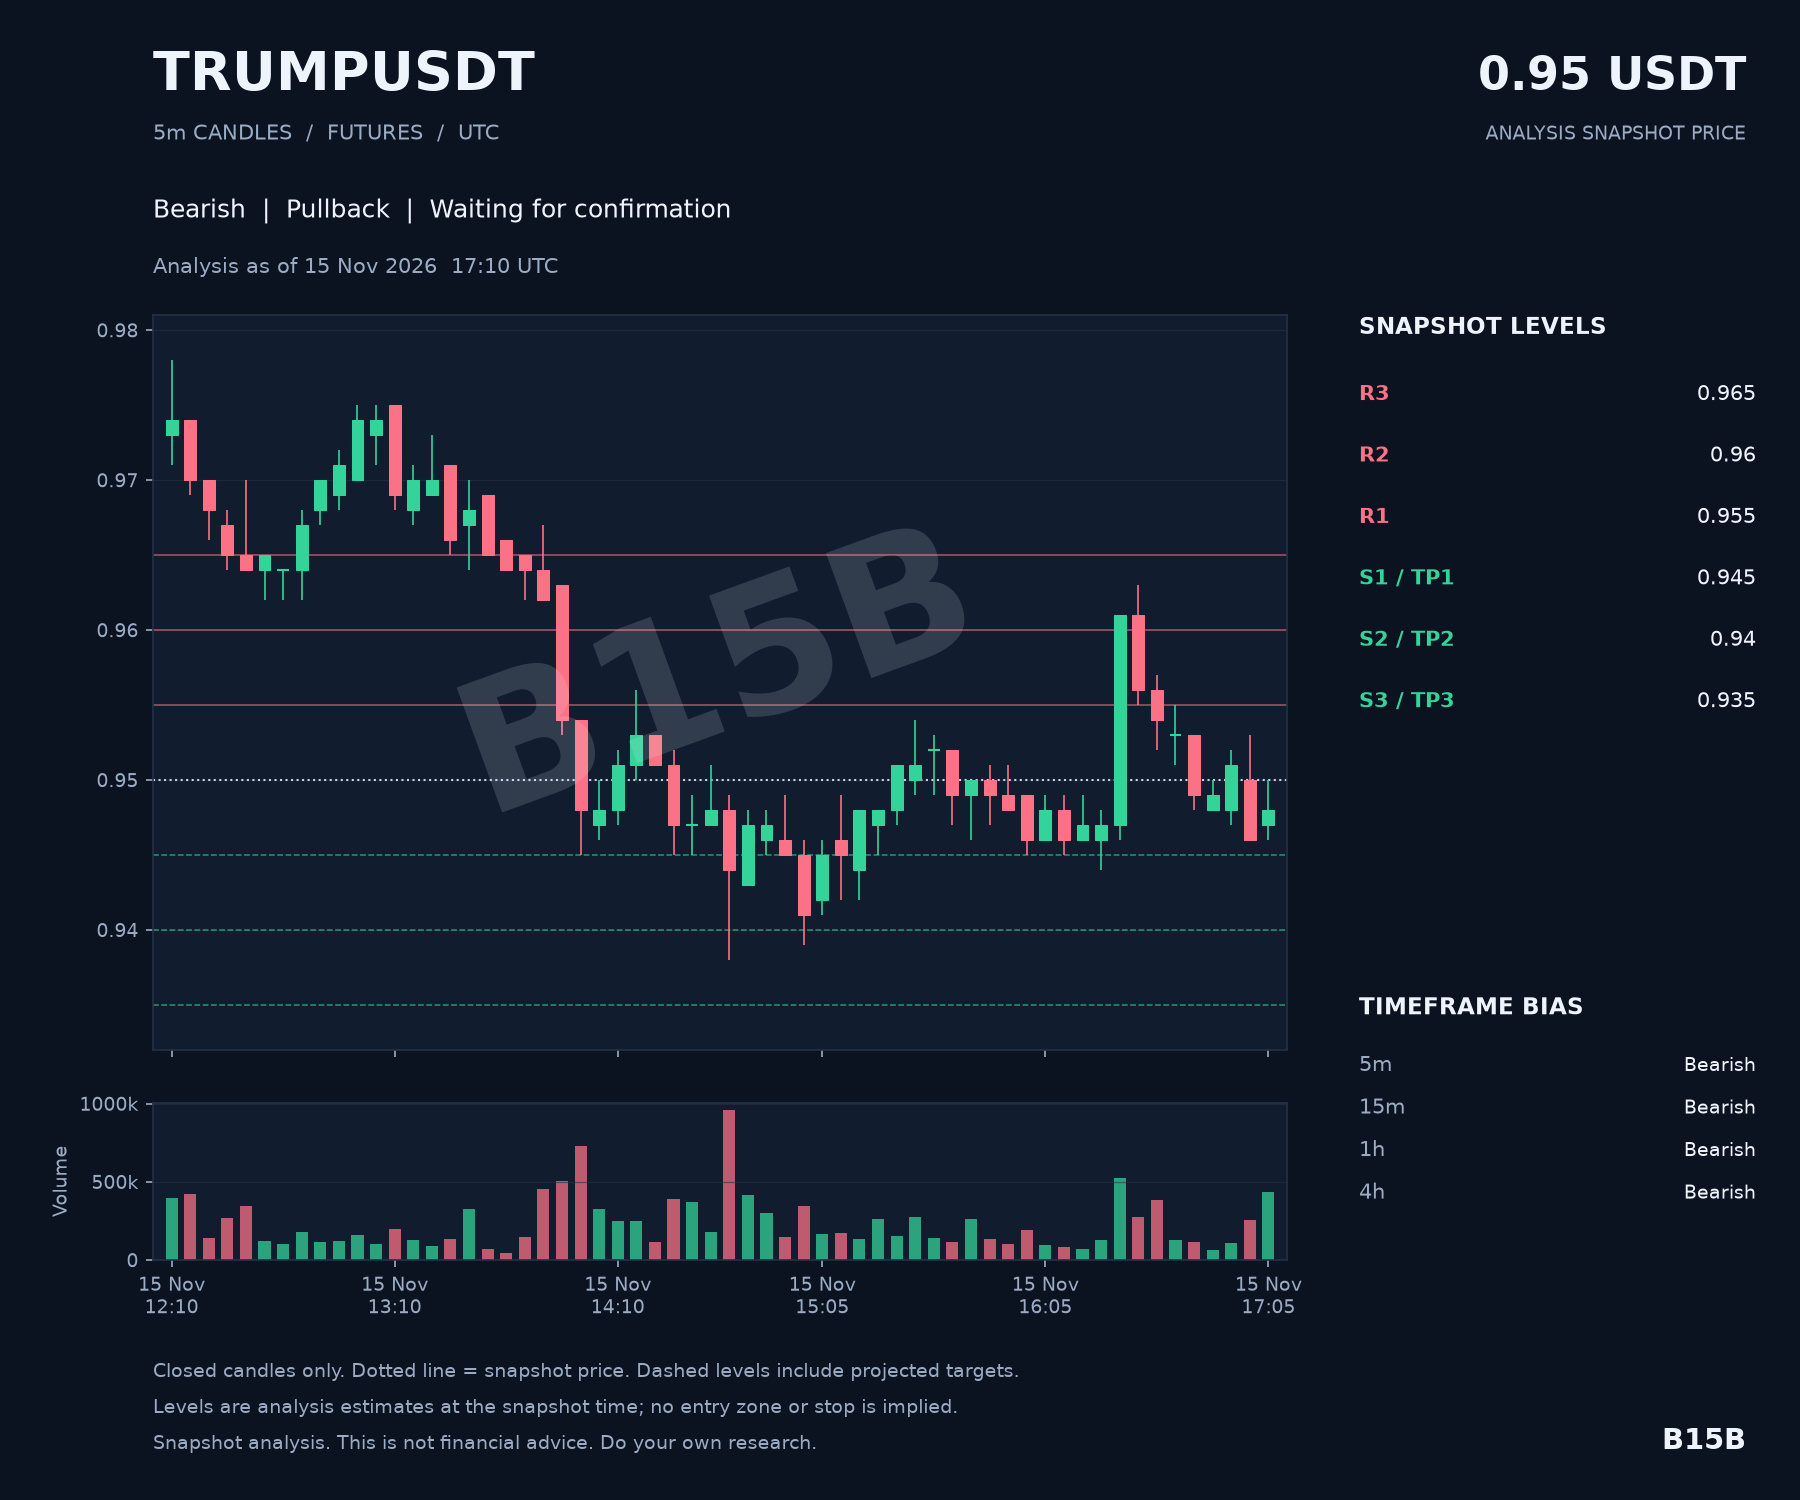
It is rare to see $TRUMP—or any asset—maintain such a unified front of bearish sentiment across the entire board. From the 5-minute micro-scalp view all the way up to the 4-hour trend, the technical signal is identical.
Currently sitting at 0.95, the price action is categorized as a pullback, but it is developing within a very heavy structural environment. We have a cluster of support levels starting at 0.945, 0.94, and 0.935, which align directly with the current scenario targets. However, with resistance sitting immediately overhead at 0.955 and 0.96, there is very little breathing room for the bulls to stage a meaningful reversal.
When you see total alignment where every single timeframe from the 5m to the 4h is bearish, what specific price behavior at the 0.945 support would you need to see to convince you that the immediate downside momentum is actually exhausted?
The setup is currently waiting on entry confirmation, meaning the market hasn't quite triggered the next move. But with the trend and bias both firmly bearish, the path of least resistance remains focused on those lower targets.
#TRUMP #CryptoAnalysis #TechnicalAnalysis #Bearish
It is rare to see $TRUMP —or any asset—maintain such a unified front of bearish sentiment across the entire board. From the 5-minute micro-scalp view all the way up to the 4-hour trend, the technical signal is identical.
Currently sitting at 0.95, the price action is categorized as a pullback, but it is developing within a very heavy structural environment. We have a cluster of support levels starting at 0.945, 0.94, and 0.935, which align directly with the current scenario targets. However, with resistance sitting immediately overhead at 0.955 and 0.96, there is very little breathing room for the bulls to stage a meaningful reversal.
When you see total alignment where every single timeframe from the 5m to the 4h is bearish, what specific price behavior at the 0.945 support would you need to see to convince you that the immediate downside momentum is actually exhausted?
The setup is currently waiting on entry confirmation, meaning the market hasn't quite triggered the next move. But with the trend and bias both firmly bearish, the path of least resistance remains focused on those lower targets.
#TRUMP #CryptoAnalysis #TechnicalAnalysis #Bearish
Currently sitting at 0.95, the price action is categorized as a pullback, but it is developing within a very heavy structural environment. We have a cluster of support levels starting at 0.945, 0.94, and 0.935, which align directly with the current scenario targets. However, with resistance sitting immediately overhead at 0.955 and 0.96, there is very little breathing room for the bulls to stage a meaningful reversal.
When you see total alignment where every single timeframe from the 5m to the 4h is bearish, what specific price behavior at the 0.945 support would you need to see to convince you that the immediate downside momentum is actually exhausted?
The setup is currently waiting on entry confirmation, meaning the market hasn't quite triggered the next move. But with the trend and bias both firmly bearish, the path of least resistance remains focused on those lower targets.
#TRUMP #CryptoAnalysis #TechnicalAnalysis #Bearish
219
·
--
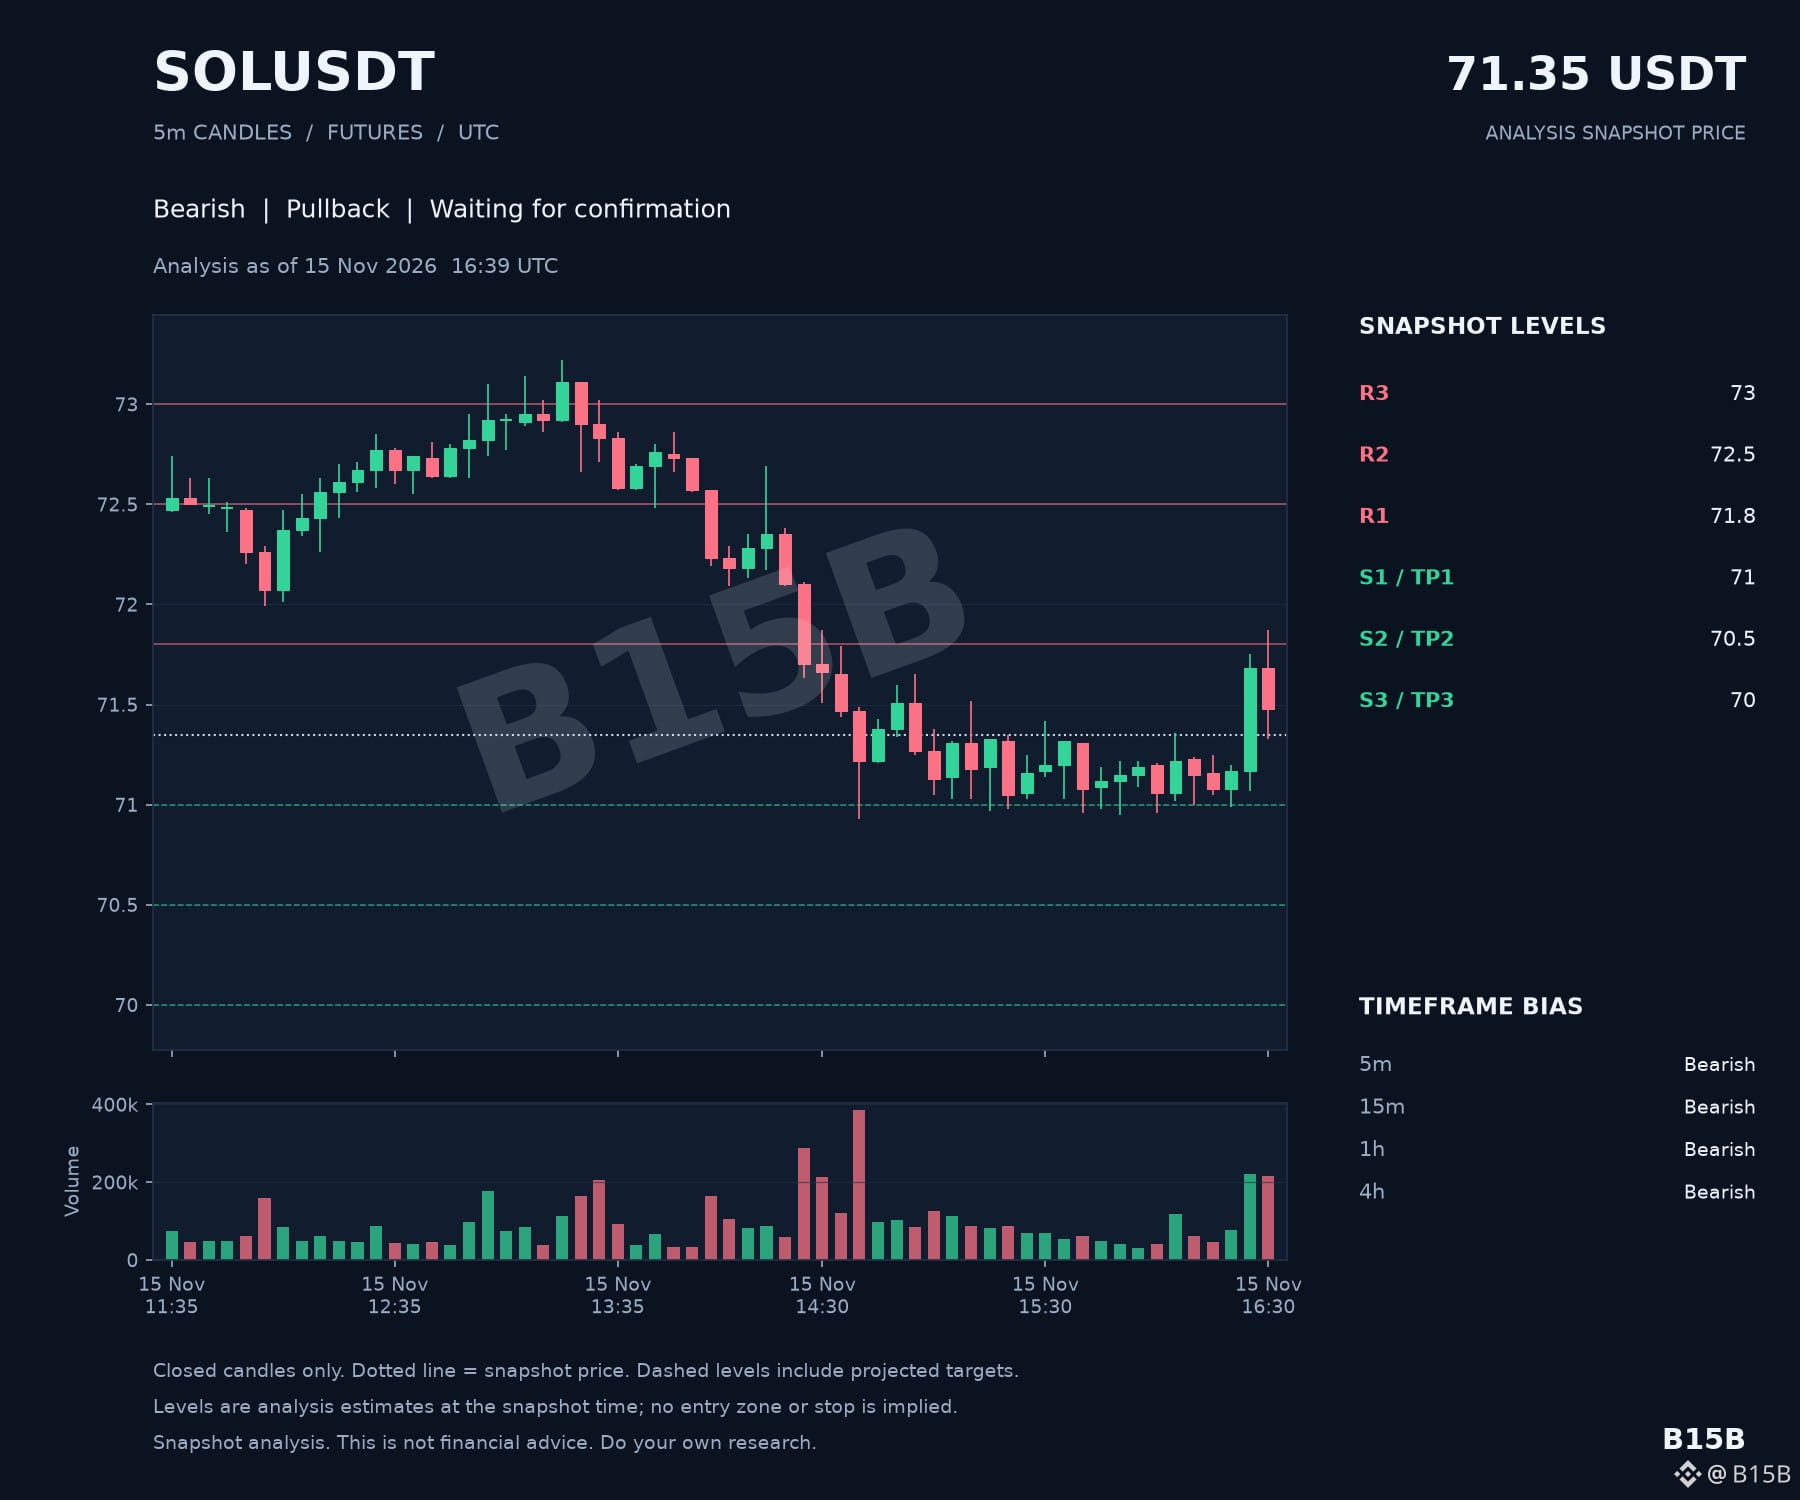
$SOL is currently navigating a very heavy technical landscape. It is rare to see such a unified front of bearish sentiment that stretches from the micro 5-minute charts all the way to the 4-hour trend, but that is exactly where the price action sits right now.
With the price currently at 71.35, the market is hovering just above a cluster of support levels starting at 71, followed by 70.5 and 70. While the technical setup is identified as a pullback, the total alignment of bearish timeframes suggests that the path of least resistance remains downward for the time being. On the flip side, any attempt at a relief rally faces immediate resistance at 71.8, with further ceilings at 72.5 and 73.
The entry confirmation for this specific scenario is still pending, meaning the market hasn't yet triggered a formal move toward those lower 70.5 and 70 targets.
When you see a chart where every single timeframe from the 5-minute to the 4-hour is aligned in a bearish direction, what specific shift in candle structure at the 71 support would you need to see to consider the "pullback" exhausted rather than just the start of a deeper slide?
#SOL #Solana #Crypto #TechnicalAnalysis #Altcoins
$SOL is currently navigating a very heavy technical landscape. It is rare to see such a unified front of bearish sentiment that stretches from the micro 5-minute charts all the way to the 4-hour trend, but that is exactly where the price action sits right now.
With the price currently at 71.35, the market is hovering just above a cluster of support levels starting at 71, followed by 70.5 and 70. While the technical setup is identified as a pullback, the total alignment of bearish timeframes suggests that the path of least resistance remains downward for the time being. On the flip side, any attempt at a relief rally faces immediate resistance at 71.8, with further ceilings at 72.5 and 73.
The entry confirmation for this specific scenario is still pending, meaning the market hasn't yet triggered a formal move toward those lower 70.5 and 70 targets.
When you see a chart where every single timeframe from the 5-minute to the 4-hour is aligned in a bearish direction, what specific shift in candle structure at the 71 support would you need to see to consider the "pullback" exhausted rather than just the start of a deeper slide?
#SOL #Solana #Crypto #TechnicalAnalysis #Altcoins
With the price currently at 71.35, the market is hovering just above a cluster of support levels starting at 71, followed by 70.5 and 70. While the technical setup is identified as a pullback, the total alignment of bearish timeframes suggests that the path of least resistance remains downward for the time being. On the flip side, any attempt at a relief rally faces immediate resistance at 71.8, with further ceilings at 72.5 and 73.
The entry confirmation for this specific scenario is still pending, meaning the market hasn't yet triggered a formal move toward those lower 70.5 and 70 targets.
When you see a chart where every single timeframe from the 5-minute to the 4-hour is aligned in a bearish direction, what specific shift in candle structure at the 71 support would you need to see to consider the "pullback" exhausted rather than just the start of a deeper slide?
#SOL #Solana #Crypto #TechnicalAnalysis #Altcoins
34
·
--
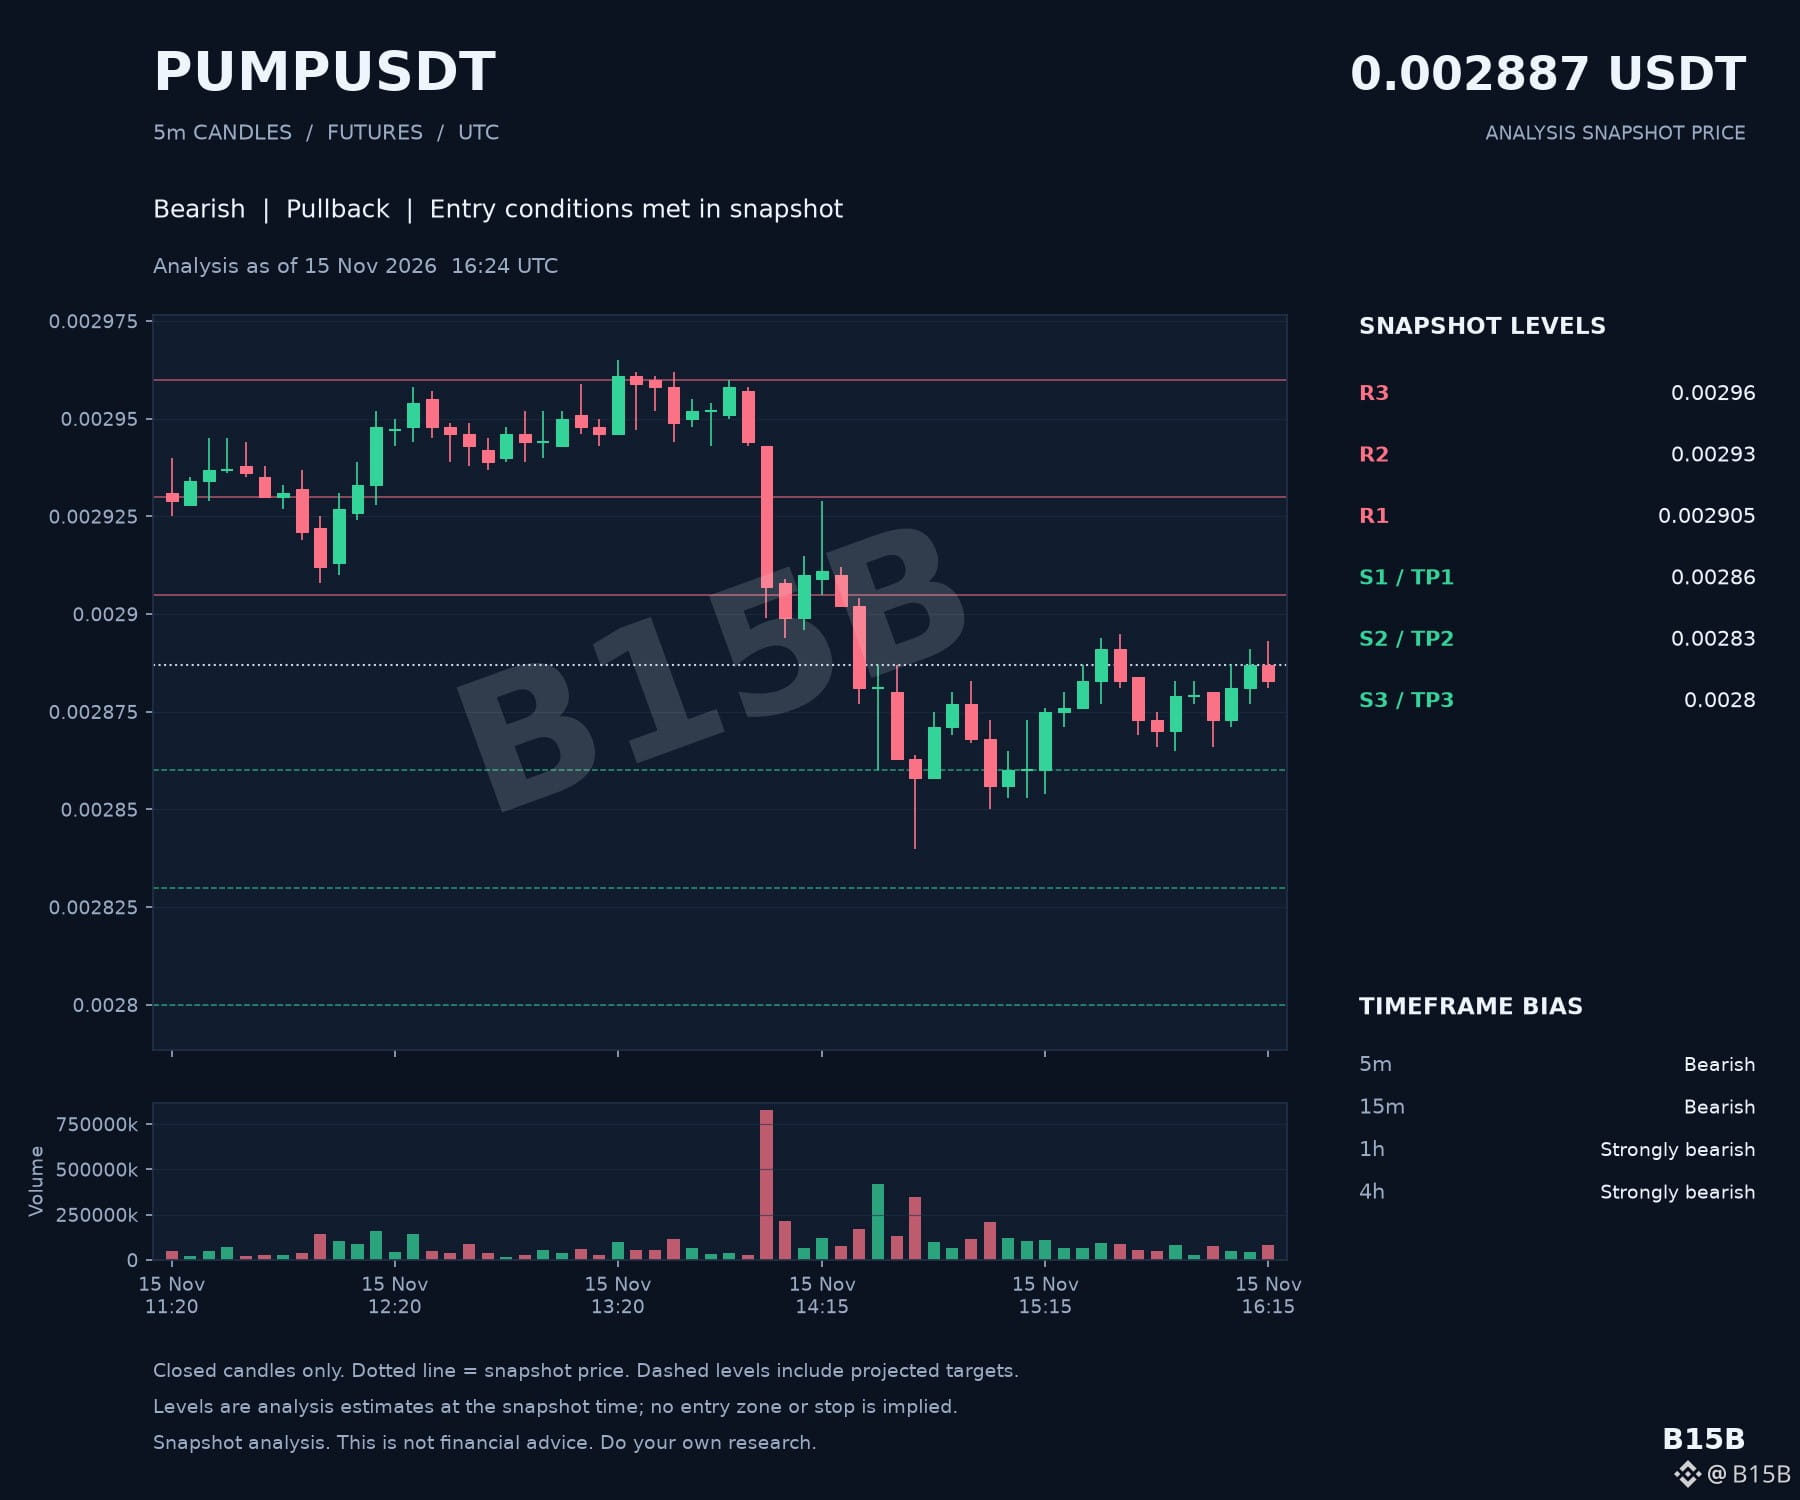
$PUMP is currently navigating a very heavy technical landscape. Despite the ticker, the price action is showing a unified front of bearish sentiment that stretches from the micro 5-minute chart all the way up to the 4-hour trend.
The market is currently in a pullback phase, and while internal entry conditions for this setup have been met, we haven't seen a confirmed execution. The trend strength is particularly notable; seeing the 1-hour and 4-hour timeframes both locked into "Strongly Bearish" status suggests that any upward bounces are facing significant structural resistance.
Key levels to watch as this structure develops:
- 🚧 Resistance: 0.002905 and 0.00293
- 🛡️ Support: 0.00286 and 0.00283
- 📉 Trend: Strongly Bearish (1h/4h)
- 🎯 Downside Scenarios: 0.00286, 0.00283, 0.0028
When you see a chart where every single timeframe from 5m to 4h is aligned in a bearish direction, what specific shift in price action at the 0.00286 support would you need to see to suggest the immediate selling pressure is finally exhausting?
With the price currently sitting at 0.002887, it is wedged tightly between the immediate 0.002905 resistance ceiling and the 0.00286 floor. ⚠️
#PUMP #CryptoAnalysis #TechnicalAnalysis #TradingView
$PUMP is currently navigating a very heavy technical landscape. Despite the ticker, the price action is showing a unified front of bearish sentiment that stretches from the micro 5-minute chart all the way up to the 4-hour trend.
The market is currently in a pullback phase, and while internal entry conditions for this setup have been met, we haven't seen a confirmed execution. The trend strength is particularly notable; seeing the 1-hour and 4-hour timeframes both locked into "Strongly Bearish" status suggests that any upward bounces are facing significant structural resistance.
Key levels to watch as this structure develops:
- 🚧 Resistance: 0.002905 and 0.00293
- 🛡️ Support: 0.00286 and 0.00283
- 📉 Trend: Strongly Bearish (1h/4h)
- 🎯 Downside Scenarios: 0.00286, 0.00283, 0.0028
When you see a chart where every single timeframe from 5m to 4h is aligned in a bearish direction, what specific shift in price action at the 0.00286 support would you need to see to suggest the immediate selling pressure is finally exhausting?
With the price currently sitting at 0.002887, it is wedged tightly between the immediate 0.002905 resistance ceiling and the 0.00286 floor. ⚠️
#PUMP #CryptoAnalysis #TechnicalAnalysis #TradingView
The market is currently in a pullback phase, and while internal entry conditions for this setup have been met, we haven't seen a confirmed execution. The trend strength is particularly notable; seeing the 1-hour and 4-hour timeframes both locked into "Strongly Bearish" status suggests that any upward bounces are facing significant structural resistance.
Key levels to watch as this structure develops:
- 🚧 Resistance: 0.002905 and 0.00293
- 🛡️ Support: 0.00286 and 0.00283
- 📉 Trend: Strongly Bearish (1h/4h)
- 🎯 Downside Scenarios: 0.00286, 0.00283, 0.0028
When you see a chart where every single timeframe from 5m to 4h is aligned in a bearish direction, what specific shift in price action at the 0.00286 support would you need to see to suggest the immediate selling pressure is finally exhausting?
With the price currently sitting at 0.002887, it is wedged tightly between the immediate 0.002905 resistance ceiling and the 0.00286 floor. ⚠️
#PUMP #CryptoAnalysis #TechnicalAnalysis #TradingView
100
·
--
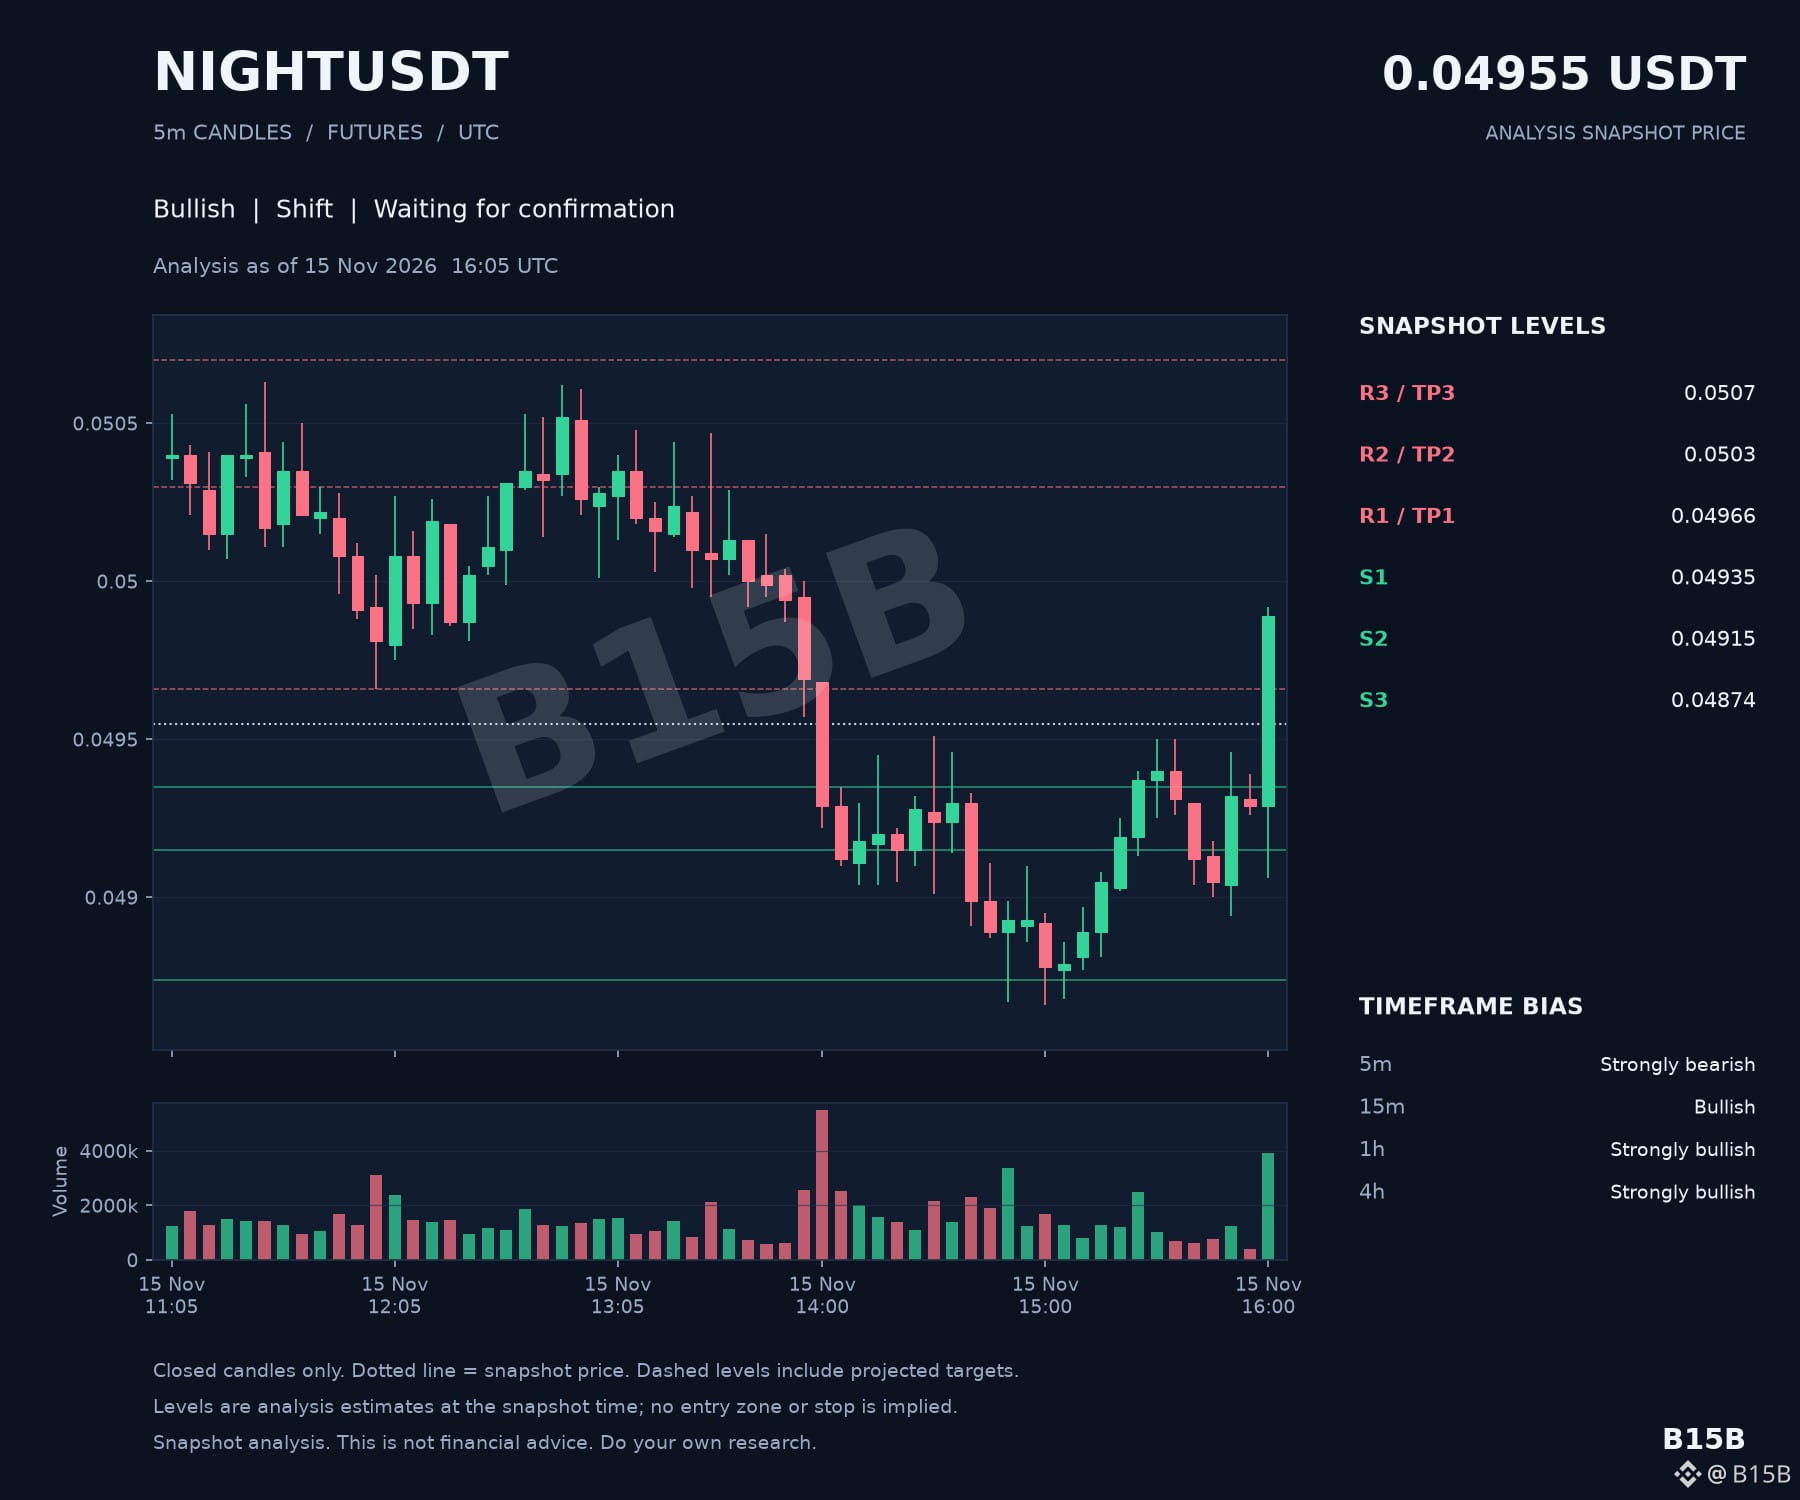
$NIGHT is currently caught in a fascinating tug-of-war between micro-volatility and macro-strength. While the higher timeframes—specifically the 1-hour and 4-hour charts—are flashing "Strongly Bullish" signals, the immediate 5-minute momentum has turned "Strongly Bearish."
This creates a "Shift" setup where the long-term trend is fighting against a sharp short-term pullback. With the current price sitting at 0.04955, we are hovering just above the first line of defense. The big question for anyone watching this structure: Given that the 5-minute timeframe is "Strongly Bearish" while the 1-hour and 4-hour trends remain "Strongly Bullish," what specific behavior at the 0.04935 support would you need to see to be convinced the macro trend is ready to resume?
Here is the structural layout for $NIGHT right now:
• 🛡️ Immediate support zone established at 0.04935 and 0.04915
• 🚧 Primary resistance targets sitting at 0.04966 and 0.0503
• 📈 Strong bullish alignment on all timeframes from 15m up to 4h
• ⚠️ Short-term 5m momentum remains strongly bearish, delaying entry confirmation
We haven't seen a confirmed entry trigger yet, which suggests the market is still digesting this local dip. If the support at 0.04935 holds firm, the path toward the 0.0503 and 0.0507 targets remains the dominant technical scenario, but a failure there could see the "Strongly Bearish" 5-minute sentiment start to bleed into the 15-minute chart. #NIGHT #CryptoAnalysis #TechnicalAnalysis #TradingSignal
$NIGHT is currently caught in a fascinating tug-of-war between micro-volatility and macro-strength. While the higher timeframes—specifically the 1-hour and 4-hour charts—are flashing "Strongly Bullish" signals, the immediate 5-minute momentum has turned "Strongly Bearish."
This creates a "Shift" setup where the long-term trend is fighting against a sharp short-term pullback. With the current price sitting at 0.04955, we are hovering just above the first line of defense. The big question for anyone watching this structure: Given that the 5-minute timeframe is "Strongly Bearish" while the 1-hour and 4-hour trends remain "Strongly Bullish," what specific behavior at the 0.04935 support would you need to see to be convinced the macro trend is ready to resume?
Here is the structural layout for $NIGHT right now:
• 🛡️ Immediate support zone established at 0.04935 and 0.04915
• 🚧 Primary resistance targets sitting at 0.04966 and 0.0503
• 📈 Strong bullish alignment on all timeframes from 15m up to 4h
• ⚠️ Short-term 5m momentum remains strongly bearish, delaying entry confirmation
We haven't seen a confirmed entry trigger yet, which suggests the market is still digesting this local dip. If the support at 0.04935 holds firm, the path toward the 0.0503 and 0.0507 targets remains the dominant technical scenario, but a failure there could see the "Strongly Bearish" 5-minute sentiment start to bleed into the 15-minute chart. #NIGHT #CryptoAnalysis #TechnicalAnalysis #TradingSignal
This creates a "Shift" setup where the long-term trend is fighting against a sharp short-term pullback. With the current price sitting at 0.04955, we are hovering just above the first line of defense. The big question for anyone watching this structure: Given that the 5-minute timeframe is "Strongly Bearish" while the 1-hour and 4-hour trends remain "Strongly Bullish," what specific behavior at the 0.04935 support would you need to see to be convinced the macro trend is ready to resume?
Here is the structural layout for $NIGHT right now:
• 🛡️ Immediate support zone established at 0.04935 and 0.04915
• 🚧 Primary resistance targets sitting at 0.04966 and 0.0503
• 📈 Strong bullish alignment on all timeframes from 15m up to 4h
• ⚠️ Short-term 5m momentum remains strongly bearish, delaying entry confirmation
We haven't seen a confirmed entry trigger yet, which suggests the market is still digesting this local dip. If the support at 0.04935 holds firm, the path toward the 0.0503 and 0.0507 targets remains the dominant technical scenario, but a failure there could see the "Strongly Bearish" 5-minute sentiment start to bleed into the 15-minute chart. #NIGHT #CryptoAnalysis #TechnicalAnalysis #TradingSignal
80
·
--
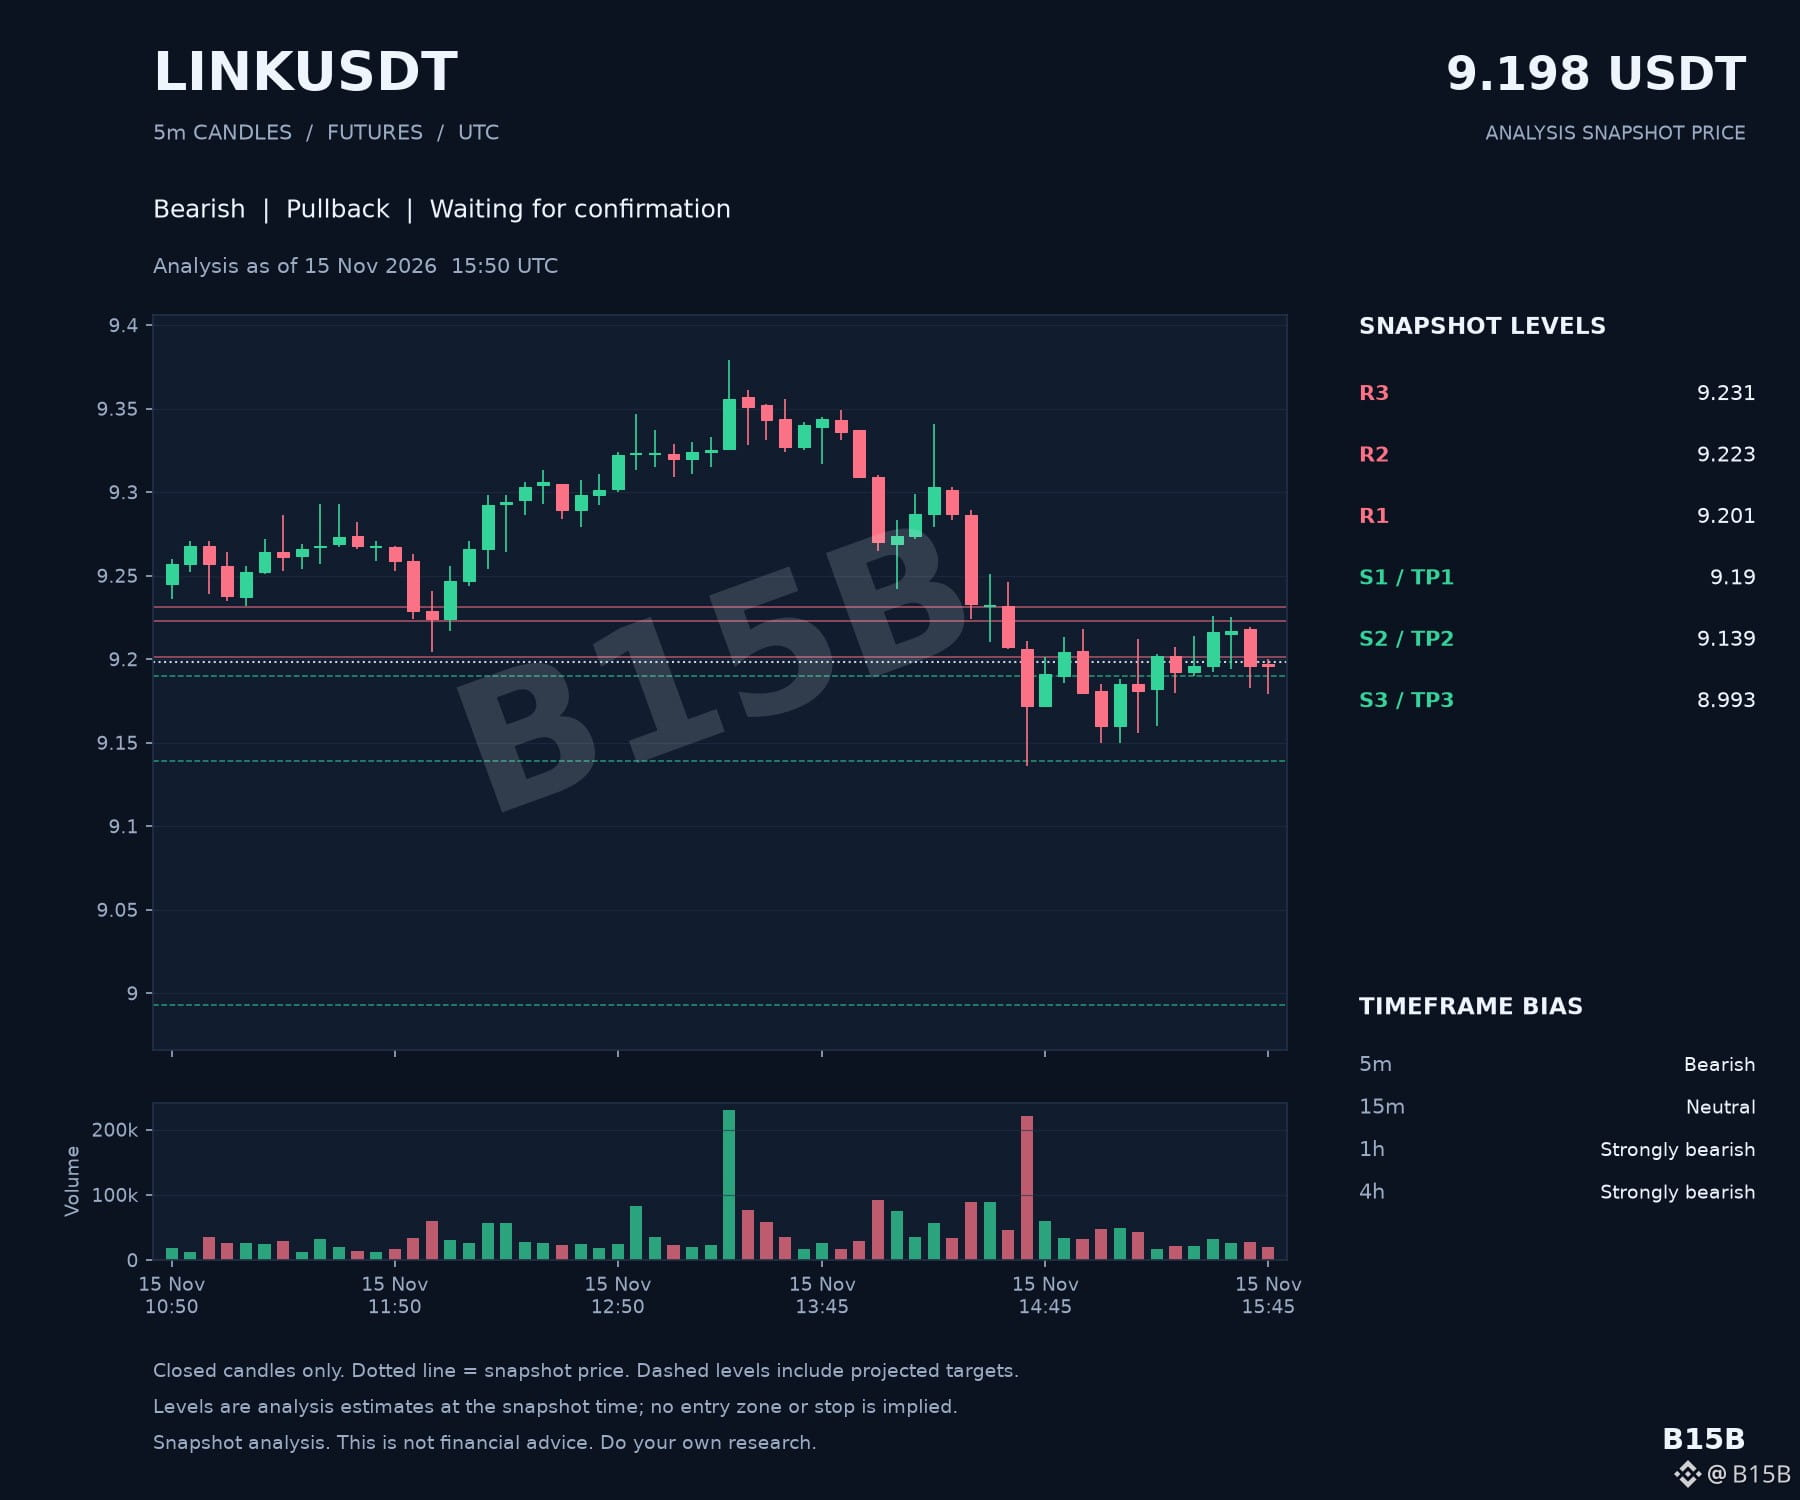
$LINK is showing significant structural weight right now. It is rare to see such a unified front of bearish sentiment across the board, with both the 1-hour and 4-hour timeframes currently characterized as "Strongly Bearish."
The price is currently hovering just above the 9.19 mark, which is the immediate line of defense. While we are seeing a "Pullback" setup on the radar, the lack of an entry trigger suggests the market is still searching for a definitive floor. The only break in the downward momentum is the 15-minute timeframe, which has flattened out into neutral territory, perhaps offering a momentary breather before the next move.
Considering the 15-minute timeframe is the only one not currently signaling a bearish trend, what specific behavior at the 9.19 support would you need to see to convince you this is a genuine stabilization rather than just a brief pause in a larger decline?
Current technical landscape:
- 🛡️ Critical Support: 9.19, 9.139, and 8.993
- 🚧 Primary Resistance: 9.201 and 9.223
- 📉 Trend Alignment: Bearish on 5m, 1h, and 4h
- 🎯 Downside Targets: 9.139 and 8.993
With price action compressed tightly between the 9.19 support and the 9.201 resistance, the room for error is shrinking. Until we see a confirmed trigger or a shift in the hourly trend, the path of least resistance remains tilted to the downside. ⚠️
$LINK is showing significant structural weight right now. It is rare to see such a unified front of bearish sentiment across the board, with both the 1-hour and 4-hour timeframes currently characterized as "Strongly Bearish."
The price is currently hovering just above the 9.19 mark, which is the immediate line of defense. While we are seeing a "Pullback" setup on the radar, the lack of an entry trigger suggests the market is still searching for a definitive floor. The only break in the downward momentum is the 15-minute timeframe, which has flattened out into neutral territory, perhaps offering a momentary breather before the next move.
Considering the 15-minute timeframe is the only one not currently signaling a bearish trend, what specific behavior at the 9.19 support would you need to see to convince you this is a genuine stabilization rather than just a brief pause in a larger decline?
Current technical landscape:
- 🛡️ Critical Support: 9.19, 9.139, and 8.993
- 🚧 Primary Resistance: 9.201 and 9.223
- 📉 Trend Alignment: Bearish on 5m, 1h, and 4h
- 🎯 Downside Targets: 9.139 and 8.993
With price action compressed tightly between the 9.19 support and the 9.201 resistance, the room for error is shrinking. Until we see a confirmed trigger or a shift in the hourly trend, the path of least resistance remains tilted to the downside. ⚠️
The price is currently hovering just above the 9.19 mark, which is the immediate line of defense. While we are seeing a "Pullback" setup on the radar, the lack of an entry trigger suggests the market is still searching for a definitive floor. The only break in the downward momentum is the 15-minute timeframe, which has flattened out into neutral territory, perhaps offering a momentary breather before the next move.
Considering the 15-minute timeframe is the only one not currently signaling a bearish trend, what specific behavior at the 9.19 support would you need to see to convince you this is a genuine stabilization rather than just a brief pause in a larger decline?
Current technical landscape:
- 🛡️ Critical Support: 9.19, 9.139, and 8.993
- 🚧 Primary Resistance: 9.201 and 9.223
- 📉 Trend Alignment: Bearish on 5m, 1h, and 4h
- 🎯 Downside Targets: 9.139 and 8.993
With price action compressed tightly between the 9.19 support and the 9.201 resistance, the room for error is shrinking. Until we see a confirmed trigger or a shift in the hourly trend, the path of least resistance remains tilted to the downside. ⚠️
37
·
--
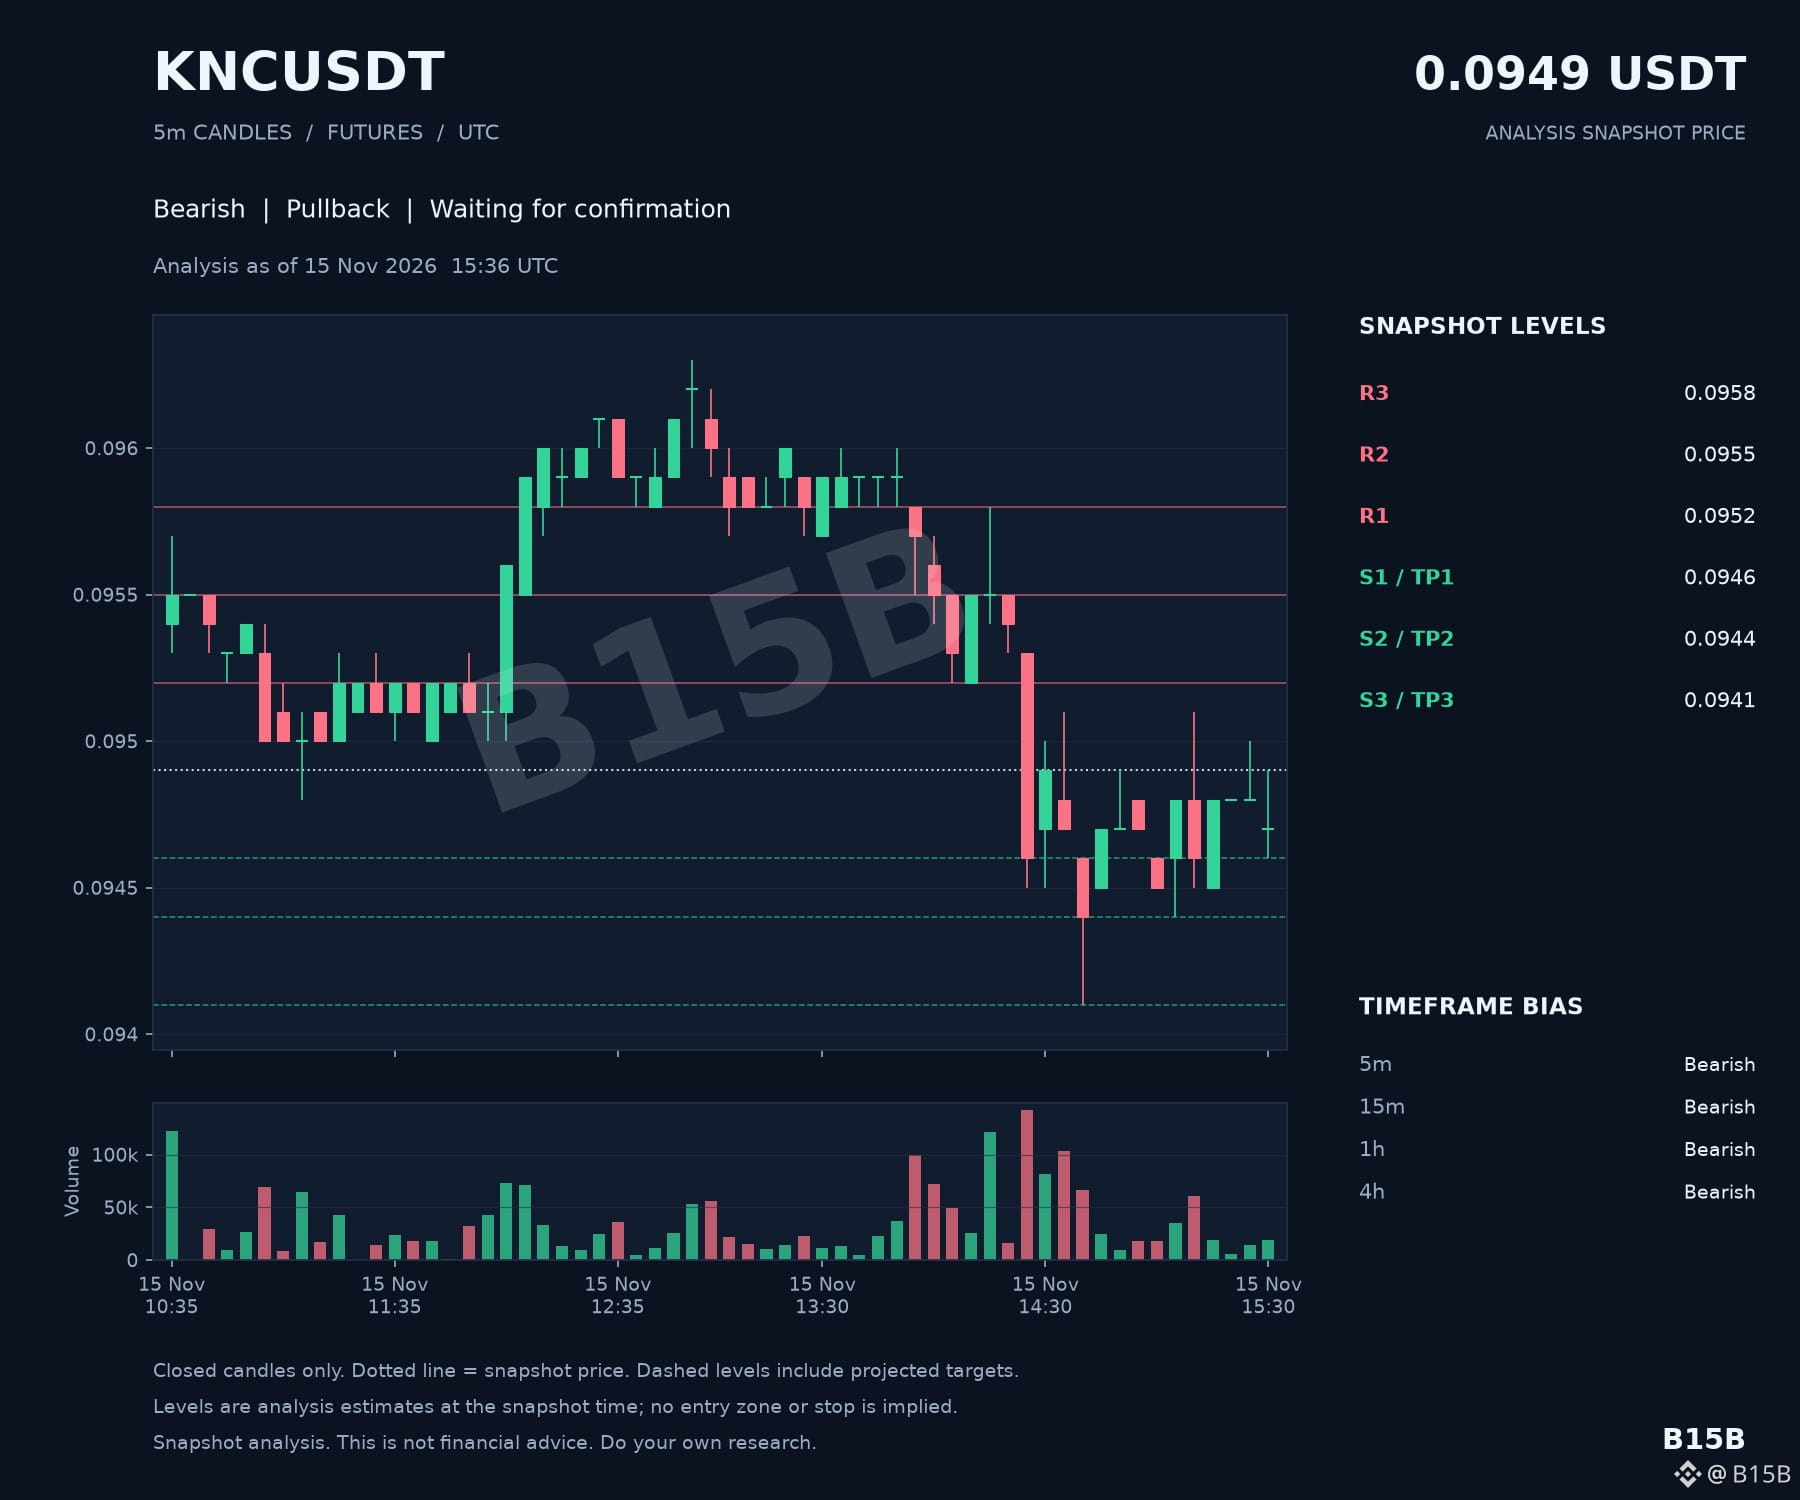
$KNC is showing a remarkably unified bearish structure right now. It is rare to see such total alignment across the board, but currently, every timeframe—from the 5-minute scalp window up to the 4-hour trend—is flashing a bearish bias.
The market is currently navigating a pullback setup, though it’s important to note that entry confirmation is still pending. Price action is hovering just above the immediate support levels, and without any divergence from the shorter timeframes to suggest a local bottom, the path of least resistance remains downward.
- 🛡️ Support Levels: 0.0946, 0.0944, 0.0941
- 🚧 Resistance Zones: 0.0952, 0.0955, 0.0958
- 📉 Trend Alignment: Bearish across 5m, 15m, 1h, and 4h
- 🎯 Scenario Targets: 0.0946, 0.0944, 0.0941
Given that there isn't a single timeframe showing even a hint of neutral or bullish momentum right now, what specific price action at the 0.0946 support would you need to see to suggest this move is reaching exhaustion rather than simply preparing for the next leg down? ⚠️
#KNC #KyberNetwork #CryptoTechnicalAnalysis #TradingView #Altcoins
$KNC is showing a remarkably unified bearish structure right now. It is rare to see such total alignment across the board, but currently, every timeframe—from the 5-minute scalp window up to the 4-hour trend—is flashing a bearish bias.
The market is currently navigating a pullback setup, though it’s important to note that entry confirmation is still pending. Price action is hovering just above the immediate support levels, and without any divergence from the shorter timeframes to suggest a local bottom, the path of least resistance remains downward.
- 🛡️ Support Levels: 0.0946, 0.0944, 0.0941
- 🚧 Resistance Zones: 0.0952, 0.0955, 0.0958
- 📉 Trend Alignment: Bearish across 5m, 15m, 1h, and 4h
- 🎯 Scenario Targets: 0.0946, 0.0944, 0.0941
Given that there isn't a single timeframe showing even a hint of neutral or bullish momentum right now, what specific price action at the 0.0946 support would you need to see to suggest this move is reaching exhaustion rather than simply preparing for the next leg down? ⚠️
#KNC #KyberNetwork #CryptoTechnicalAnalysis #TradingView #Altcoins
The market is currently navigating a pullback setup, though it’s important to note that entry confirmation is still pending. Price action is hovering just above the immediate support levels, and without any divergence from the shorter timeframes to suggest a local bottom, the path of least resistance remains downward.
- 🛡️ Support Levels: 0.0946, 0.0944, 0.0941
- 🚧 Resistance Zones: 0.0952, 0.0955, 0.0958
- 📉 Trend Alignment: Bearish across 5m, 15m, 1h, and 4h
- 🎯 Scenario Targets: 0.0946, 0.0944, 0.0941
Given that there isn't a single timeframe showing even a hint of neutral or bullish momentum right now, what specific price action at the 0.0946 support would you need to see to suggest this move is reaching exhaustion rather than simply preparing for the next leg down? ⚠️
#KNC #KyberNetwork #CryptoTechnicalAnalysis #TradingView #Altcoins
18
·
--
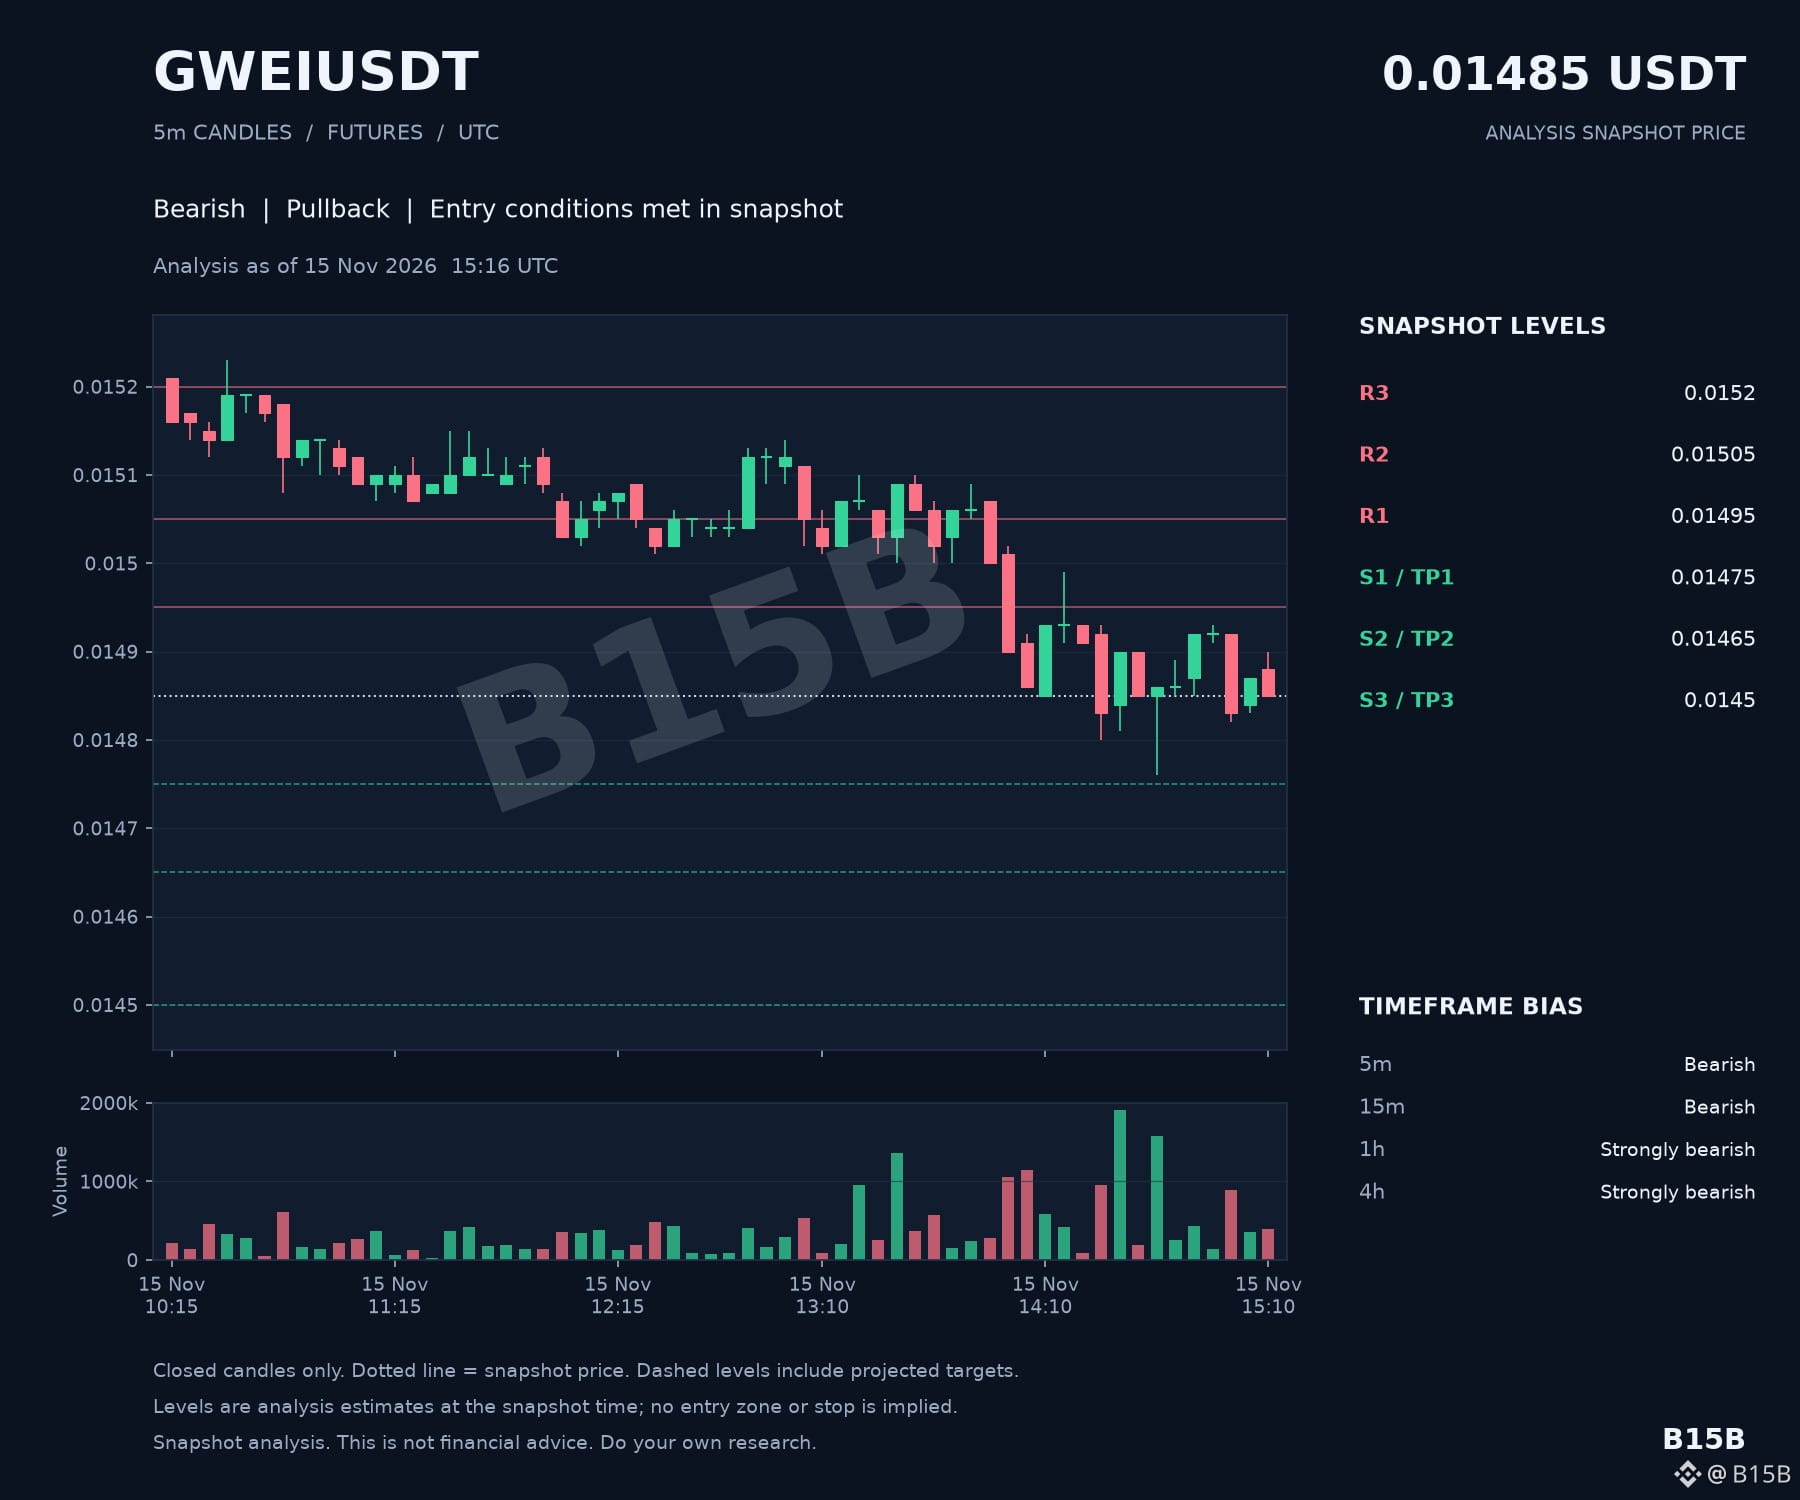
$GWEI is showing a remarkably unified bearish structure right now. It is rare to see such total alignment across the board, but currently, every timeframe—from the 5-minute scalp window to the 4-hour trend—is flashing red.
The most striking part of the data is the "Strongly Bearish" designation on the 1-hour and 4-hour charts. This suggests that the current downward momentum isn't just a brief dip, but a well-established trend that is putting significant pressure on the 0.01485 price level. While we are seeing a pullback setup where internal entry conditions have been met, the overhead resistance remains a significant barrier for any potential recovery.
- 🚧 Primary resistance is sitting at 0.01495 and 0.01505.
- 🛡️ Immediate downside targets align with support at 0.01475 and 0.01465.
- 📉 Higher timeframes (1h/4h) are currently categorized as "Strongly Bearish."
When you see the 1-hour and 4-hour timeframes both reaching "Strongly Bearish" status simultaneously, how does that change your approach to identifying a potential floor compared to a standard bearish trend? 📉
The path of least resistance for $GWEI currently appears to be lower, with the 0.0145 level acting as the final major support in the current scenario. Watching how price reacts to the 0.01495 resistance will likely dictate whether this pullback finds a ceiling or attempts to break the prevailing trend.
#GWEI #CryptoAnalysis #TechnicalAnalysis #TradingView
$GWEI is showing a remarkably unified bearish structure right now. It is rare to see such total alignment across the board, but currently, every timeframe—from the 5-minute scalp window to the 4-hour trend—is flashing red.
The most striking part of the data is the "Strongly Bearish" designation on the 1-hour and 4-hour charts. This suggests that the current downward momentum isn't just a brief dip, but a well-established trend that is putting significant pressure on the 0.01485 price level. While we are seeing a pullback setup where internal entry conditions have been met, the overhead resistance remains a significant barrier for any potential recovery.
- 🚧 Primary resistance is sitting at 0.01495 and 0.01505.
- 🛡️ Immediate downside targets align with support at 0.01475 and 0.01465.
- 📉 Higher timeframes (1h/4h) are currently categorized as "Strongly Bearish."
When you see the 1-hour and 4-hour timeframes both reaching "Strongly Bearish" status simultaneously, how does that change your approach to identifying a potential floor compared to a standard bearish trend? 📉
The path of least resistance for $GWEI currently appears to be lower, with the 0.0145 level acting as the final major support in the current scenario. Watching how price reacts to the 0.01495 resistance will likely dictate whether this pullback finds a ceiling or attempts to break the prevailing trend.
#GWEI #CryptoAnalysis #TechnicalAnalysis #TradingView
The most striking part of the data is the "Strongly Bearish" designation on the 1-hour and 4-hour charts. This suggests that the current downward momentum isn't just a brief dip, but a well-established trend that is putting significant pressure on the 0.01485 price level. While we are seeing a pullback setup where internal entry conditions have been met, the overhead resistance remains a significant barrier for any potential recovery.
- 🚧 Primary resistance is sitting at 0.01495 and 0.01505.
- 🛡️ Immediate downside targets align with support at 0.01475 and 0.01465.
- 📉 Higher timeframes (1h/4h) are currently categorized as "Strongly Bearish."
When you see the 1-hour and 4-hour timeframes both reaching "Strongly Bearish" status simultaneously, how does that change your approach to identifying a potential floor compared to a standard bearish trend? 📉
The path of least resistance for $GWEI currently appears to be lower, with the 0.0145 level acting as the final major support in the current scenario. Watching how price reacts to the 0.01495 resistance will likely dictate whether this pullback finds a ceiling or attempts to break the prevailing trend.
#GWEI #CryptoAnalysis #TechnicalAnalysis #TradingView
90
·
--
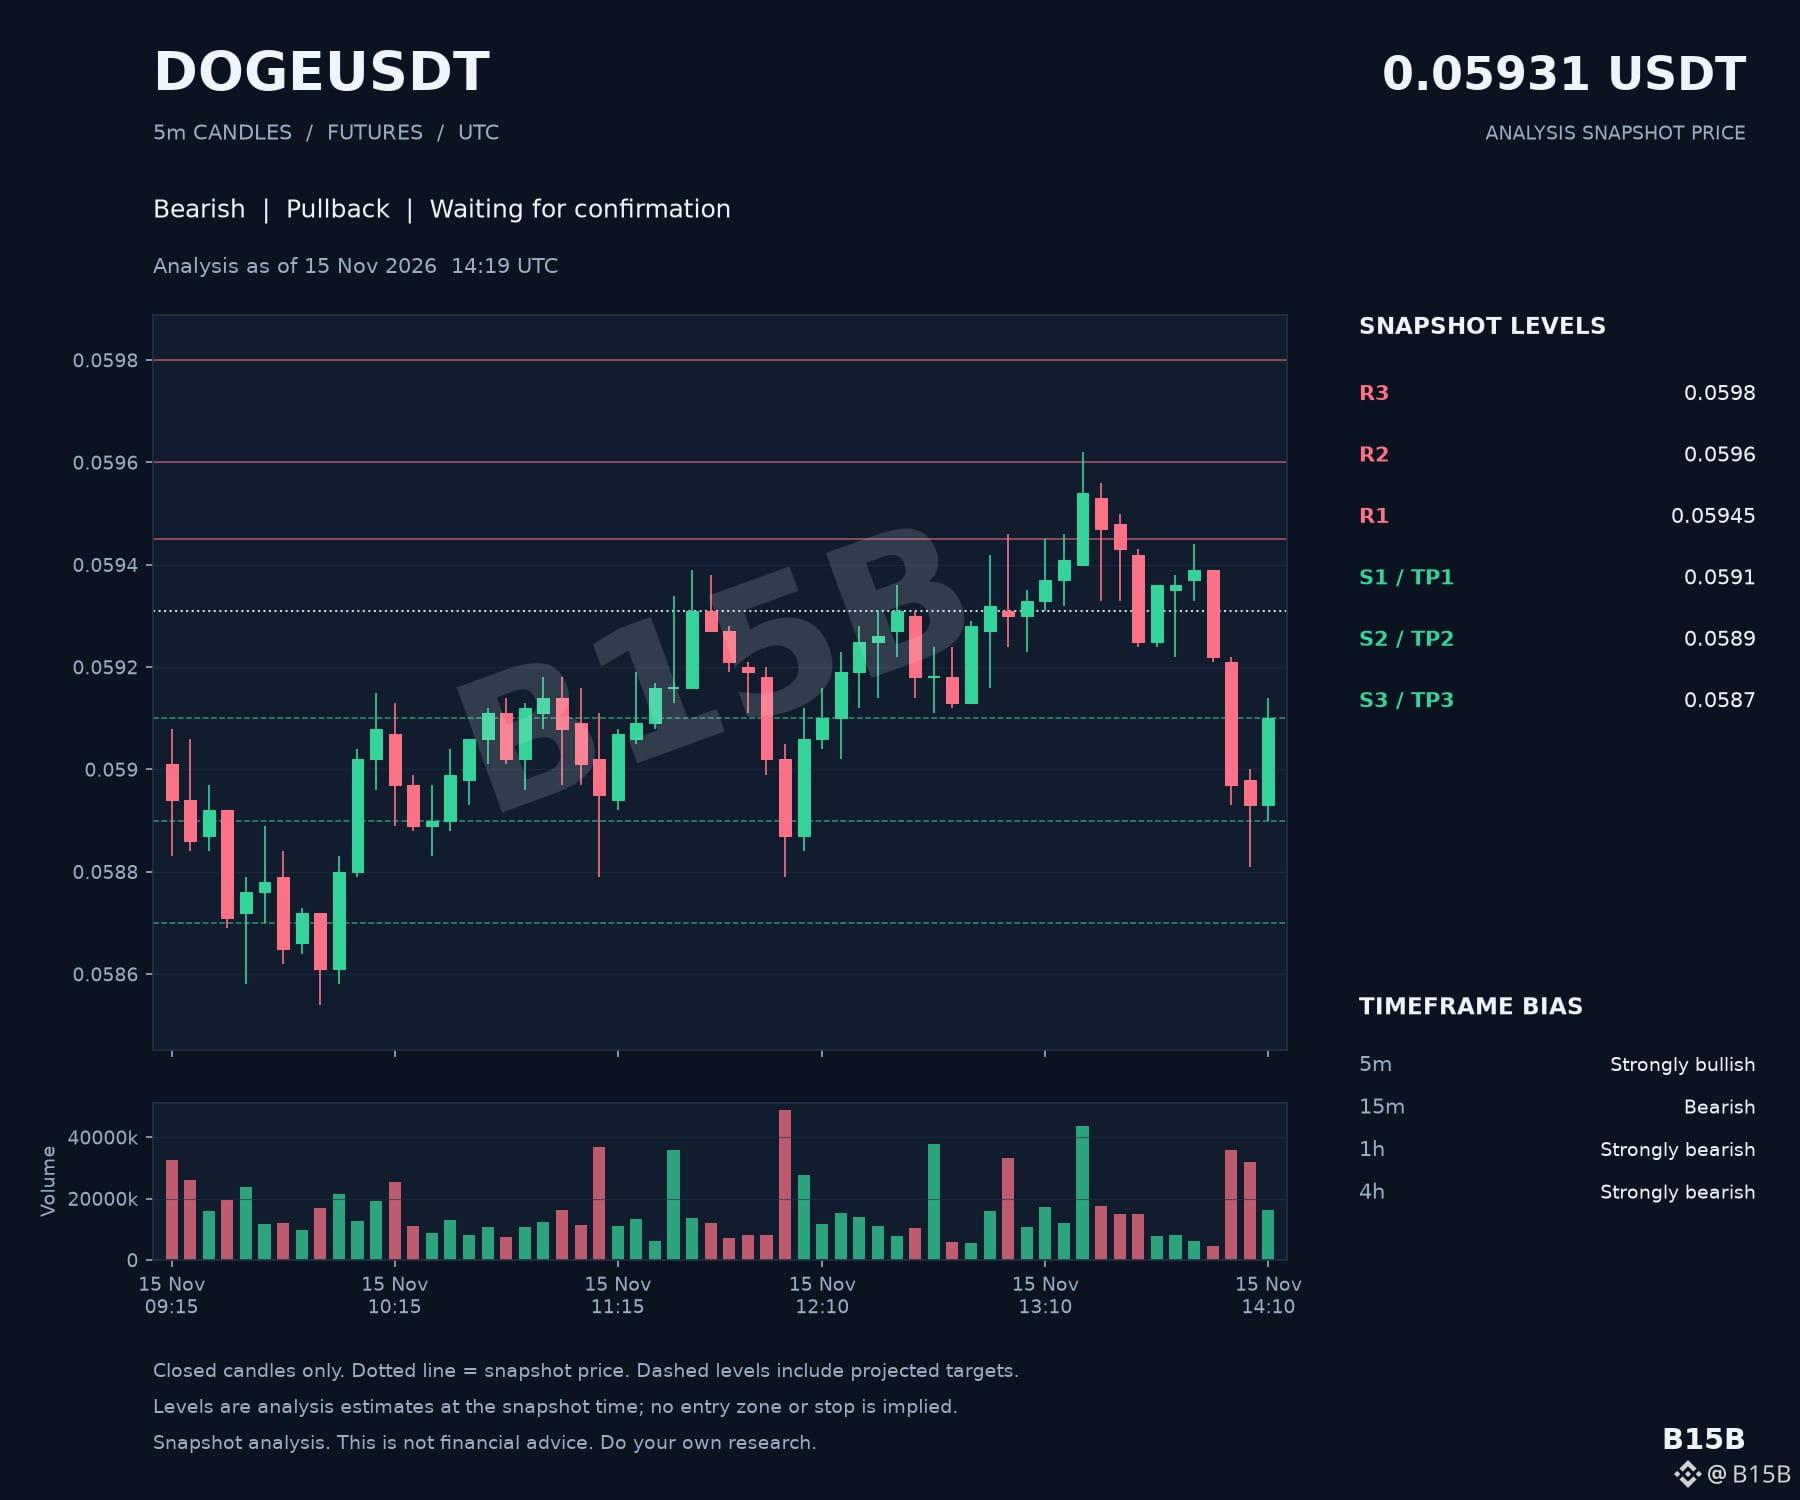
$DOGE is currently caught in a sharp divergence between short-term noise and long-term structure. While the 5-minute timeframe is flashing "Strongly Bullish" momentum, it is running directly into the heavy weight of a broader bearish trend.
The current setup is characterized as a pullback, suggesting that the immediate strength might just be a temporary bounce within a larger decline. With the 1-hour and 4-hour charts still firmly in "Strongly Bearish" territory, the market is waiting to see if this micro-recovery can actually challenge overhead supply or if it will simply provide a better exit for sellers.
When you see "Strongly Bullish" momentum on the 5-minute chart while the 1-hour and 4-hour trends remain "Strongly Bearish," what specific price action or volume shift would you need to see at resistance to believe this is more than just a brief relief rally?
- 🚧 Resistance: 0.05945 and 0.0596
- 🛡️ Support: 0.0591 and 0.0589
- 📉 Trend: Bearish (pending entry confirmation)
The technicals suggest targets at 0.0591 and potentially lower if the 0.0587 level comes into play. For now, entry confirmation remains pending as the market tests the strength of this intraday move. ⚠️
#DOGE #CryptoAnalysis #TechnicalAnalysis #Altcoins #TradingView
$DOGE is currently caught in a sharp divergence between short-term noise and long-term structure. While the 5-minute timeframe is flashing "Strongly Bullish" momentum, it is running directly into the heavy weight of a broader bearish trend.
The current setup is characterized as a pullback, suggesting that the immediate strength might just be a temporary bounce within a larger decline. With the 1-hour and 4-hour charts still firmly in "Strongly Bearish" territory, the market is waiting to see if this micro-recovery can actually challenge overhead supply or if it will simply provide a better exit for sellers.
When you see "Strongly Bullish" momentum on the 5-minute chart while the 1-hour and 4-hour trends remain "Strongly Bearish," what specific price action or volume shift would you need to see at resistance to believe this is more than just a brief relief rally?
- 🚧 Resistance: 0.05945 and 0.0596
- 🛡️ Support: 0.0591 and 0.0589
- 📉 Trend: Bearish (pending entry confirmation)
The technicals suggest targets at 0.0591 and potentially lower if the 0.0587 level comes into play. For now, entry confirmation remains pending as the market tests the strength of this intraday move. ⚠️
#DOGE #CryptoAnalysis #TechnicalAnalysis #Altcoins #TradingView
The current setup is characterized as a pullback, suggesting that the immediate strength might just be a temporary bounce within a larger decline. With the 1-hour and 4-hour charts still firmly in "Strongly Bearish" territory, the market is waiting to see if this micro-recovery can actually challenge overhead supply or if it will simply provide a better exit for sellers.
When you see "Strongly Bullish" momentum on the 5-minute chart while the 1-hour and 4-hour trends remain "Strongly Bearish," what specific price action or volume shift would you need to see at resistance to believe this is more than just a brief relief rally?
- 🚧 Resistance: 0.05945 and 0.0596
- 🛡️ Support: 0.0591 and 0.0589
- 📉 Trend: Bearish (pending entry confirmation)
The technicals suggest targets at 0.0591 and potentially lower if the 0.0587 level comes into play. For now, entry confirmation remains pending as the market tests the strength of this intraday move. ⚠️
#DOGE #CryptoAnalysis #TechnicalAnalysis #Altcoins #TradingView
42
·
--
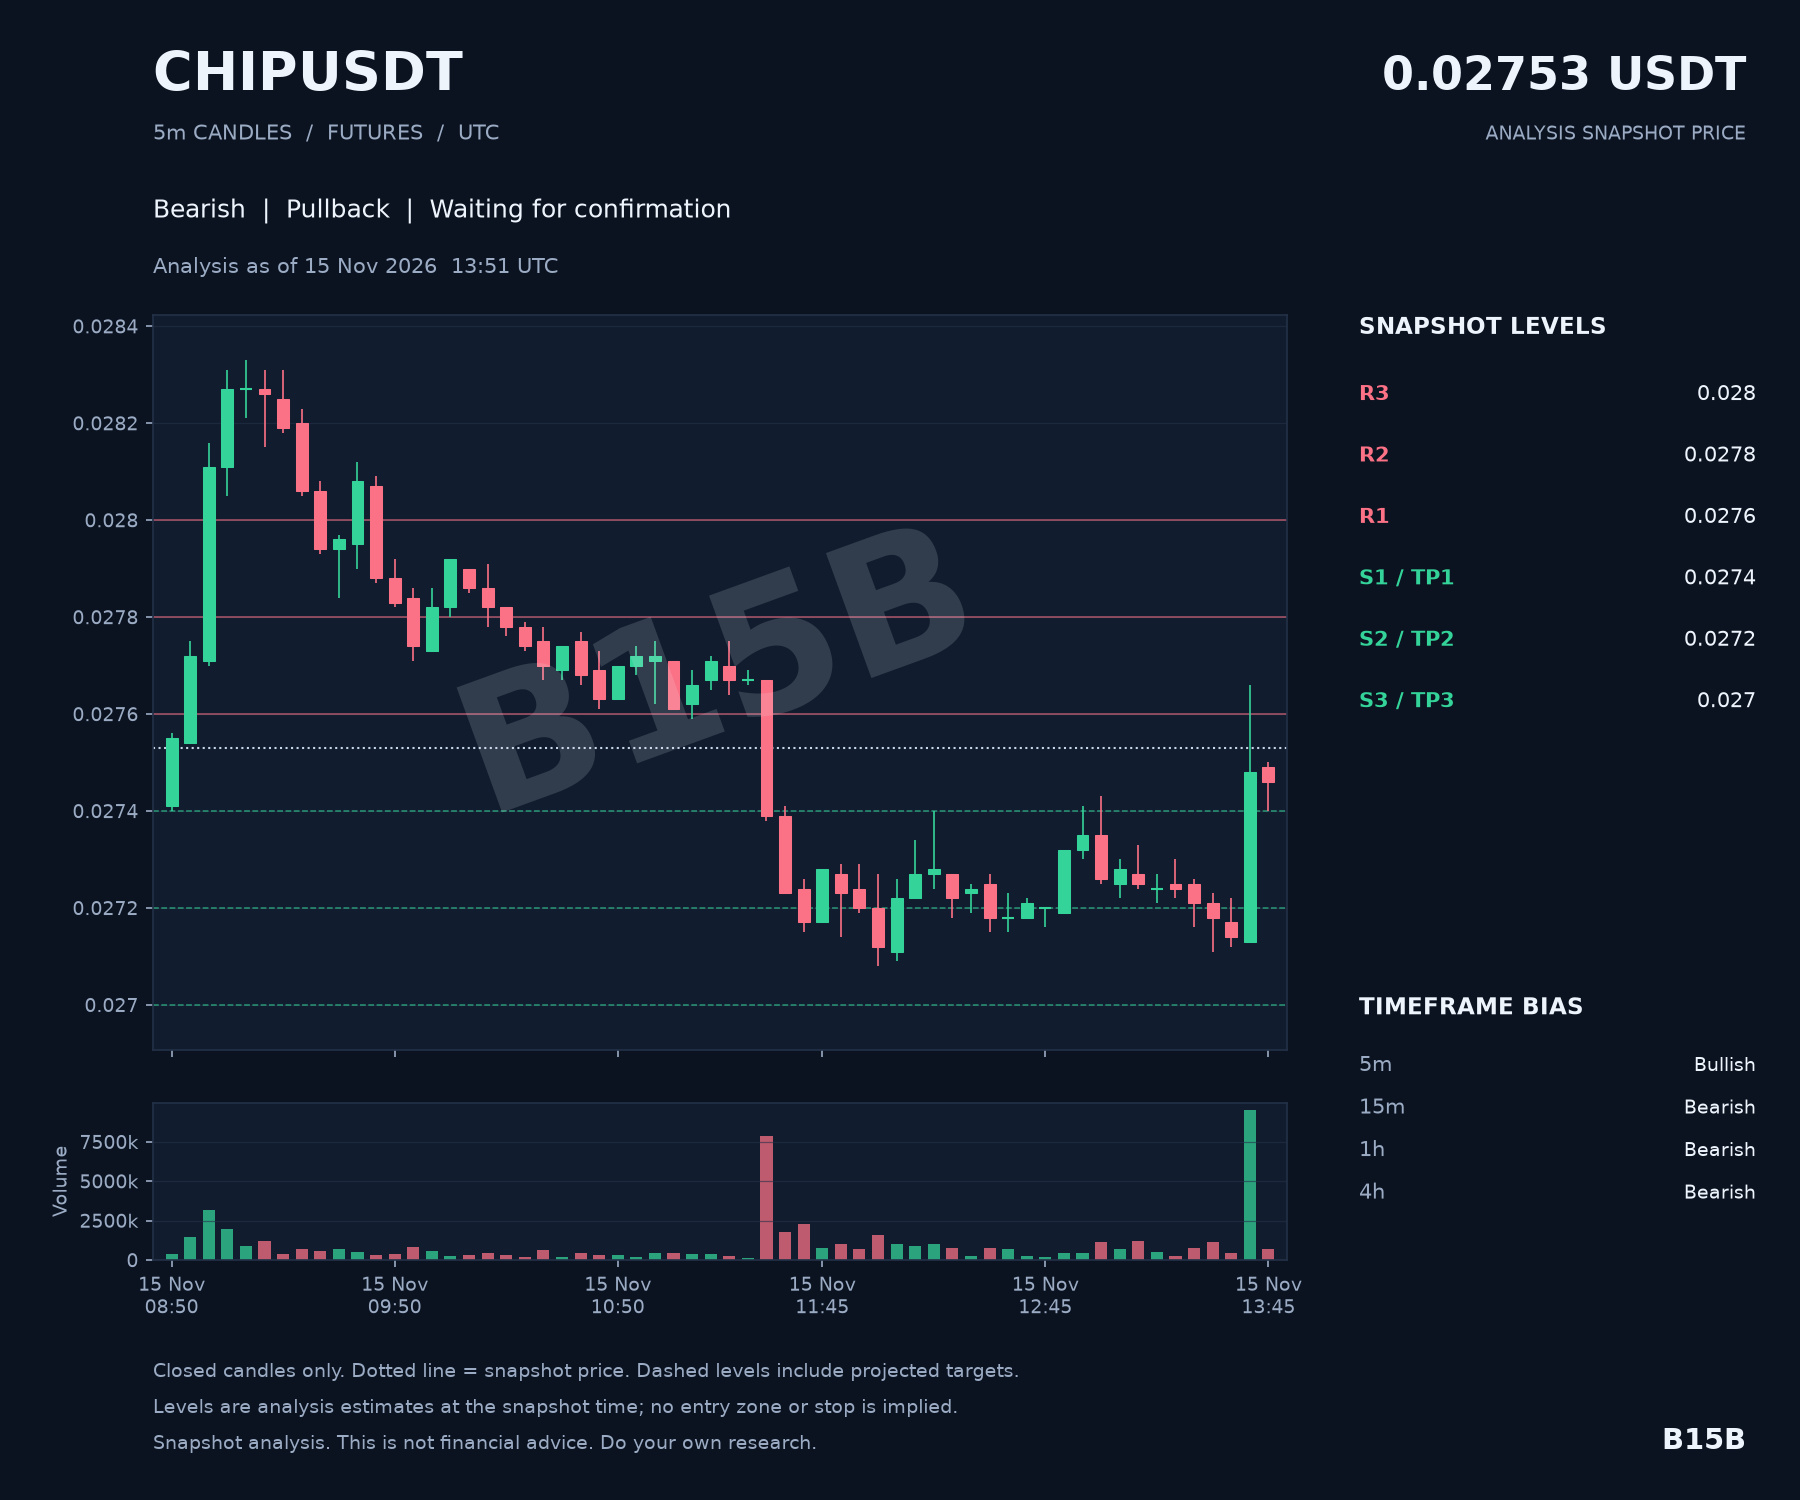
$CHIP is currently navigating a classic conflict between micro-timeframe momentum and broader structural trends. While we are seeing some bullish life on the 5-minute chart, the 15-minute, 1-hour, and 4-hour timeframes remain firmly bearish. This suggests the current move is likely a pullback within a larger downtrend rather than a full-scale reversal.
With the price sitting at 0.02753, the market is essentially testing the resolve of the bears. Confirmation for a new entry is still pending as we watch how price reacts to the immediate overhead resistance.
• 🚧 Key resistance to watch: 0.0276 and 0.0278
• 🛡️ Support floors: 0.0274 and 0.0272
• 📉 Downside scenario targets: 0.0272 and 0.027
Given that the 5-minute timeframe is the only one showing bullish momentum right now, what specific price action at the 0.0276 resistance would you need to see to convince you this is more than just a temporary relief rally? 🎯
$CHIP is currently navigating a classic conflict between micro-timeframe momentum and broader structural trends. While we are seeing some bullish life on the 5-minute chart, the 15-minute, 1-hour, and 4-hour timeframes remain firmly bearish. This suggests the current move is likely a pullback within a larger downtrend rather than a full-scale reversal.
With the price sitting at 0.02753, the market is essentially testing the resolve of the bears. Confirmation for a new entry is still pending as we watch how price reacts to the immediate overhead resistance.
• 🚧 Key resistance to watch: 0.0276 and 0.0278
• 🛡️ Support floors: 0.0274 and 0.0272
• 📉 Downside scenario targets: 0.0272 and 0.027
Given that the 5-minute timeframe is the only one showing bullish momentum right now, what specific price action at the 0.0276 resistance would you need to see to convince you this is more than just a temporary relief rally? 🎯
With the price sitting at 0.02753, the market is essentially testing the resolve of the bears. Confirmation for a new entry is still pending as we watch how price reacts to the immediate overhead resistance.
• 🚧 Key resistance to watch: 0.0276 and 0.0278
• 🛡️ Support floors: 0.0274 and 0.0272
• 📉 Downside scenario targets: 0.0272 and 0.027
Given that the 5-minute timeframe is the only one showing bullish momentum right now, what specific price action at the 0.0276 resistance would you need to see to convince you this is more than just a temporary relief rally? 🎯
61
·
--
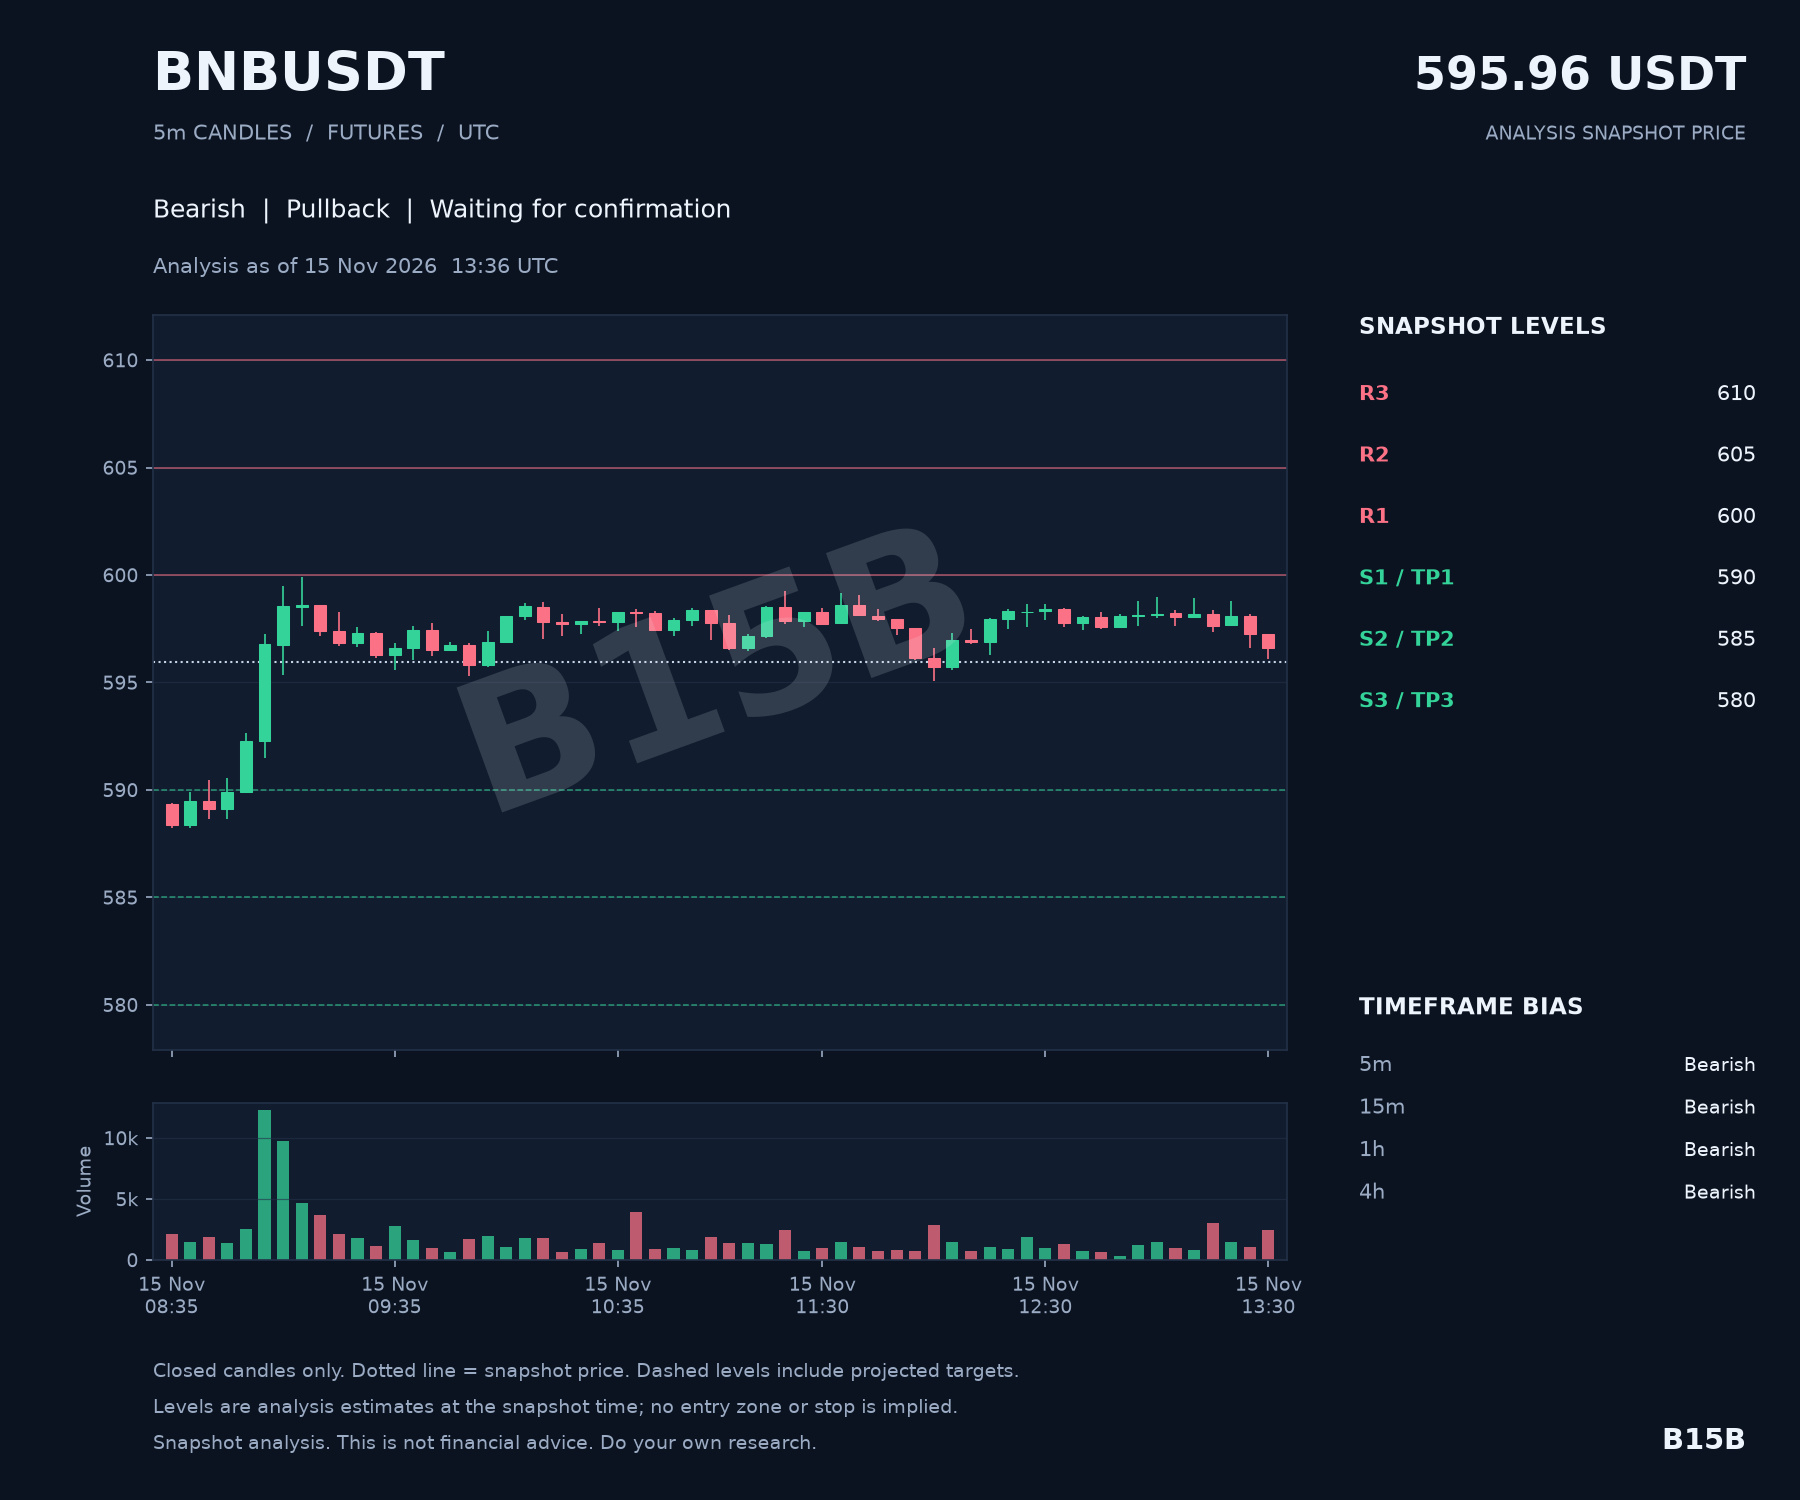
$BNB is looking heavy as it struggles to maintain its footing above the $600 mark. It is rare to see such a clean sweep of bearish sentiment, but currently, every timeframe from the 5-minute scalping charts up to the 4-hour trend is aligned in a downward trajectory.
The market is currently categorized as being in a "pullback" phase. While the macro trend is clearly leaning lower, we are seeing a momentary pause or retracement as the price hovers around $595.96. However, without a confirmed entry trigger to the upside, the path of least resistance remains tilted toward the established support levels below.
Looking at the immediate structure:
- 🚧 Resistance: Heavy selling pressure clustered at $600, $605, and $610.
- 🛡️ Support: Immediate downside targets sitting at $590, $585, and $580.
- 📉 Trend: Unanimous bearish alignment across 5m, 15m, 1h, and 4h timeframes.
Given that the entire technical stack—from micro-volatility to the 4-hour trend—is flashing bearish, what specific shift in price action or volume at the $600 resistance would you need to see to convince you that this is a bottoming formation rather than just a brief pause before a move toward $580? ⚠️
The $600 level is acting as a significant psychological and technical ceiling right now. Until $BNB can reclaim that handle with conviction, the bears seem content to control the narrative. Watch those support levels closely if the current pullback loses its steam. #BNB #CryptoAnalysis #TechnicalAnalysis
$BNB is looking heavy as it struggles to maintain its footing above the $600 mark. It is rare to see such a clean sweep of bearish sentiment, but currently, every timeframe from the 5-minute scalping charts up to the 4-hour trend is aligned in a downward trajectory.
The market is currently categorized as being in a "pullback" phase. While the macro trend is clearly leaning lower, we are seeing a momentary pause or retracement as the price hovers around $595.96. However, without a confirmed entry trigger to the upside, the path of least resistance remains tilted toward the established support levels below.
Looking at the immediate structure:
- 🚧 Resistance: Heavy selling pressure clustered at $600, $605, and $610.
- 🛡️ Support: Immediate downside targets sitting at $590, $585, and $580.
- 📉 Trend: Unanimous bearish alignment across 5m, 15m, 1h, and 4h timeframes.
Given that the entire technical stack—from micro-volatility to the 4-hour trend—is flashing bearish, what specific shift in price action or volume at the $600 resistance would you need to see to convince you that this is a bottoming formation rather than just a brief pause before a move toward $580? ⚠️
The $600 level is acting as a significant psychological and technical ceiling right now. Until $BNB can reclaim that handle with conviction, the bears seem content to control the narrative. Watch those support levels closely if the current pullback loses its steam. #BNB #CryptoAnalysis #TechnicalAnalysis
The market is currently categorized as being in a "pullback" phase. While the macro trend is clearly leaning lower, we are seeing a momentary pause or retracement as the price hovers around $595.96. However, without a confirmed entry trigger to the upside, the path of least resistance remains tilted toward the established support levels below.
Looking at the immediate structure:
- 🚧 Resistance: Heavy selling pressure clustered at $600, $605, and $610.
- 🛡️ Support: Immediate downside targets sitting at $590, $585, and $580.
- 📉 Trend: Unanimous bearish alignment across 5m, 15m, 1h, and 4h timeframes.
Given that the entire technical stack—from micro-volatility to the 4-hour trend—is flashing bearish, what specific shift in price action or volume at the $600 resistance would you need to see to convince you that this is a bottoming formation rather than just a brief pause before a move toward $580? ⚠️
The $600 level is acting as a significant psychological and technical ceiling right now. Until $BNB can reclaim that handle with conviction, the bears seem content to control the narrative. Watch those support levels closely if the current pullback loses its steam. #BNB #CryptoAnalysis #TechnicalAnalysis
23
·
--
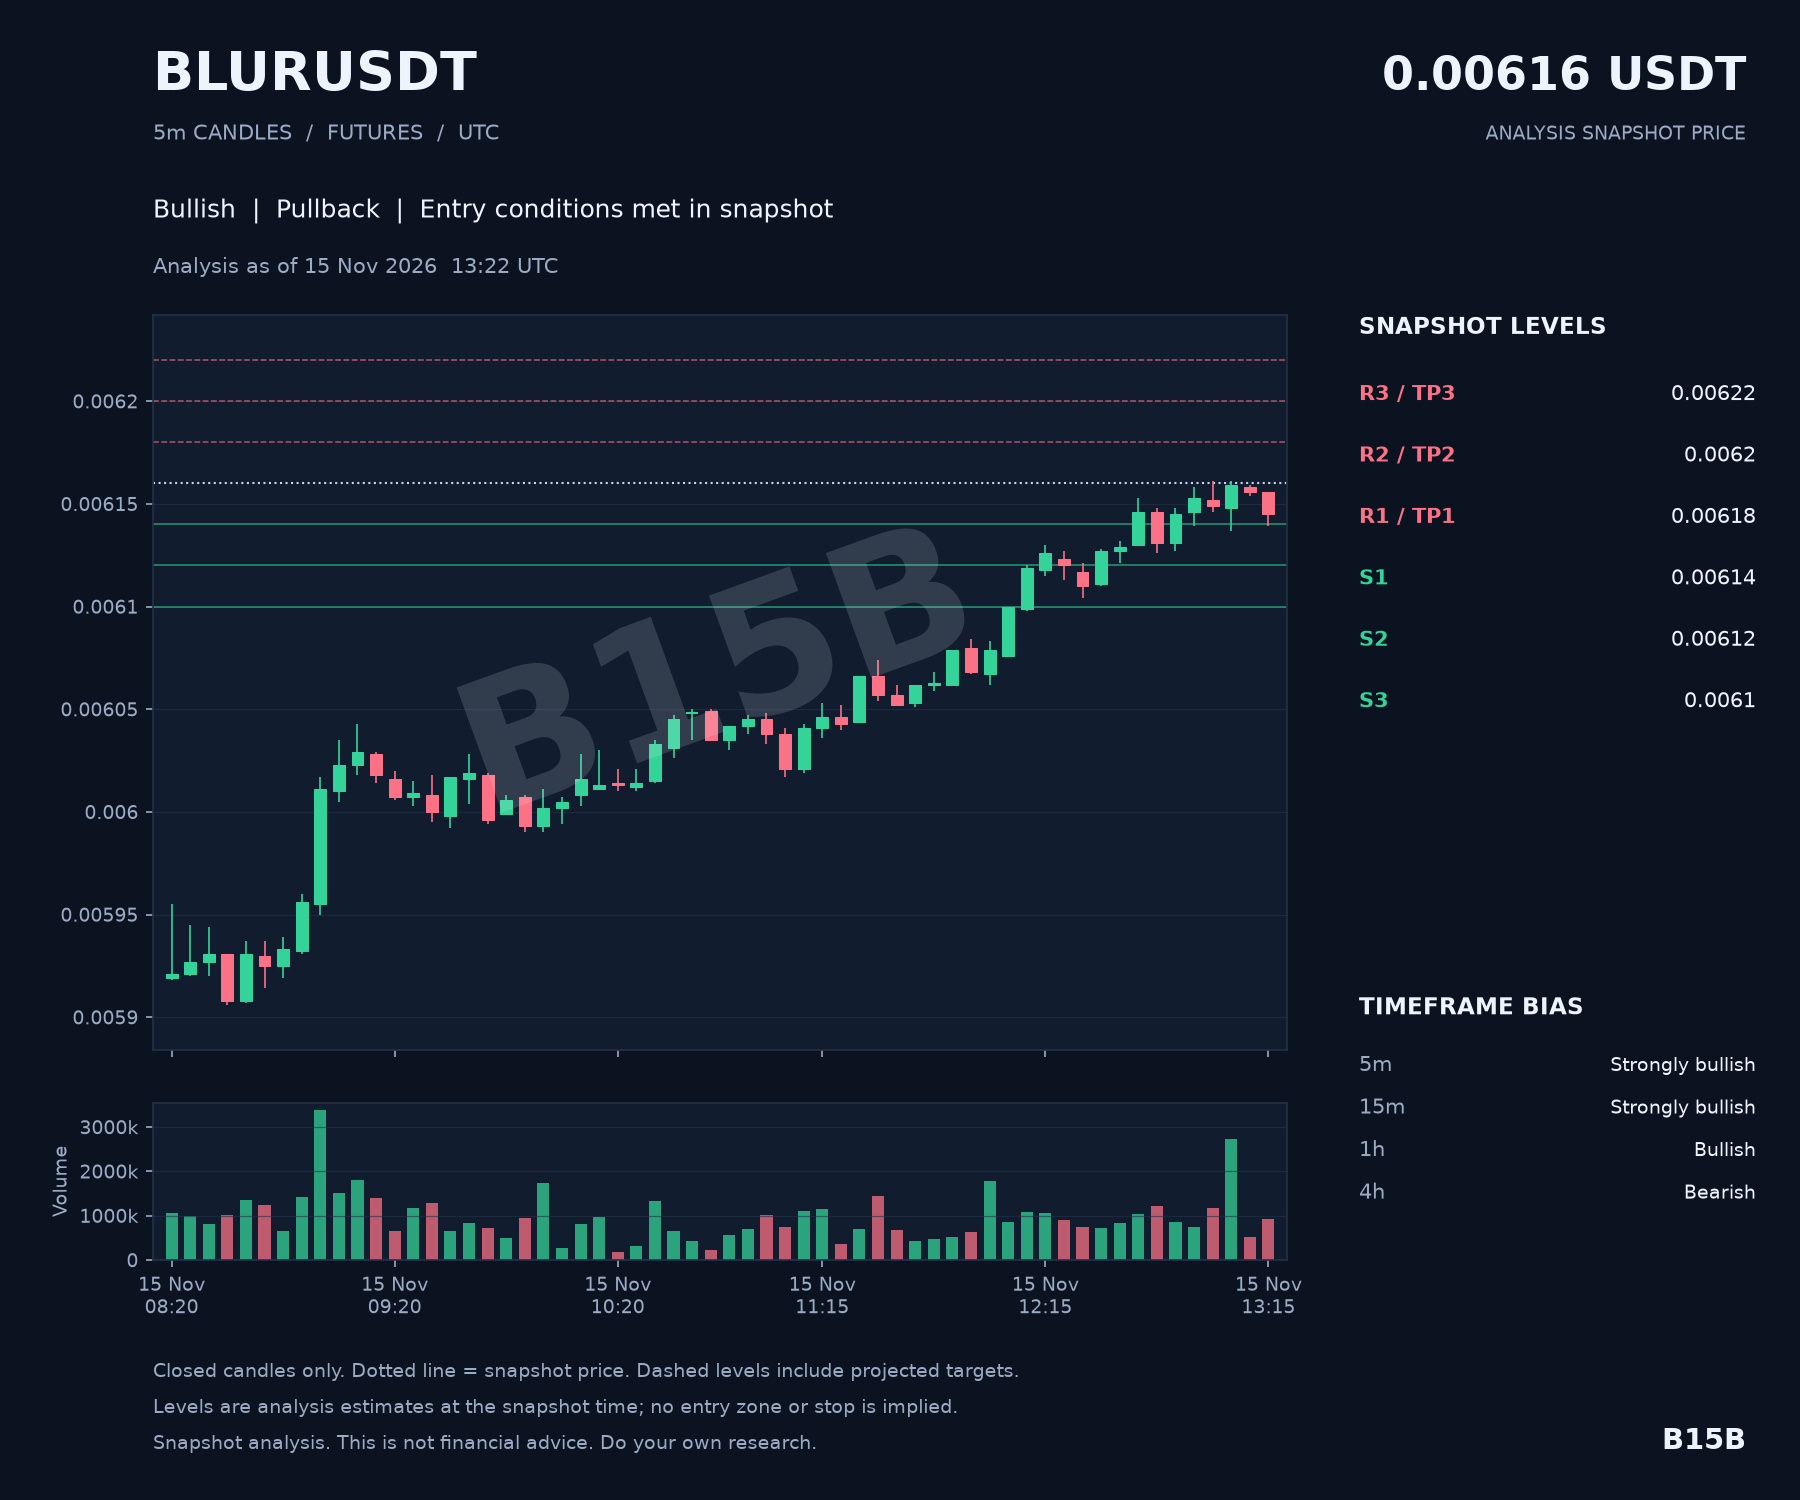
$BLUR is currently caught in a fascinating divergence. While the ultra-short-term timeframes (5m and 15m) are flashing "Strongly Bullish" signals, the 4-hour chart remains firmly bearish. This creates a classic tug-of-war between immediate momentum and the broader trend.
We are seeing a pullback setup where internal entry conditions have been met, but the price is still navigating heavy overhead levels. At 0.00616, the asset is squeezed between immediate support and the first layer of local resistance.
How do you interpret "Strongly Bullish" micro-timeframe momentum when it is running directly into a 4-hour bearish trend—does this look like the start of a structural shift or just a temporary relief bounce?
• 🛡️ Key Support Zone: 0.00614 – 0.0061
• 🚧 Primary Resistance: 0.00618 – 0.00622
• 🎯 Scenario Targets: 0.00618, 0.0062, and 0.00622
The tightening range suggests a decision is coming soon. If the bulls can push through 0.00618, it might signal that the short-term strength is finally overriding the 4h bearish pressure. However, with the higher timeframe still leaning down, any rejection at resistance warrants caution. 📈⚠️
$BLUR is currently caught in a fascinating divergence. While the ultra-short-term timeframes (5m and 15m) are flashing "Strongly Bullish" signals, the 4-hour chart remains firmly bearish. This creates a classic tug-of-war between immediate momentum and the broader trend.
We are seeing a pullback setup where internal entry conditions have been met, but the price is still navigating heavy overhead levels. At 0.00616, the asset is squeezed between immediate support and the first layer of local resistance.
How do you interpret "Strongly Bullish" micro-timeframe momentum when it is running directly into a 4-hour bearish trend—does this look like the start of a structural shift or just a temporary relief bounce?
• 🛡️ Key Support Zone: 0.00614 – 0.0061
• 🚧 Primary Resistance: 0.00618 – 0.00622
• 🎯 Scenario Targets: 0.00618, 0.0062, and 0.00622
The tightening range suggests a decision is coming soon. If the bulls can push through 0.00618, it might signal that the short-term strength is finally overriding the 4h bearish pressure. However, with the higher timeframe still leaning down, any rejection at resistance warrants caution. 📈⚠️
We are seeing a pullback setup where internal entry conditions have been met, but the price is still navigating heavy overhead levels. At 0.00616, the asset is squeezed between immediate support and the first layer of local resistance.
How do you interpret "Strongly Bullish" micro-timeframe momentum when it is running directly into a 4-hour bearish trend—does this look like the start of a structural shift or just a temporary relief bounce?
• 🛡️ Key Support Zone: 0.00614 – 0.0061
• 🚧 Primary Resistance: 0.00618 – 0.00622
• 🎯 Scenario Targets: 0.00618, 0.0062, and 0.00622
The tightening range suggests a decision is coming soon. If the bulls can push through 0.00618, it might signal that the short-term strength is finally overriding the 4h bearish pressure. However, with the higher timeframe still leaning down, any rejection at resistance warrants caution. 📈⚠️
31
·
--
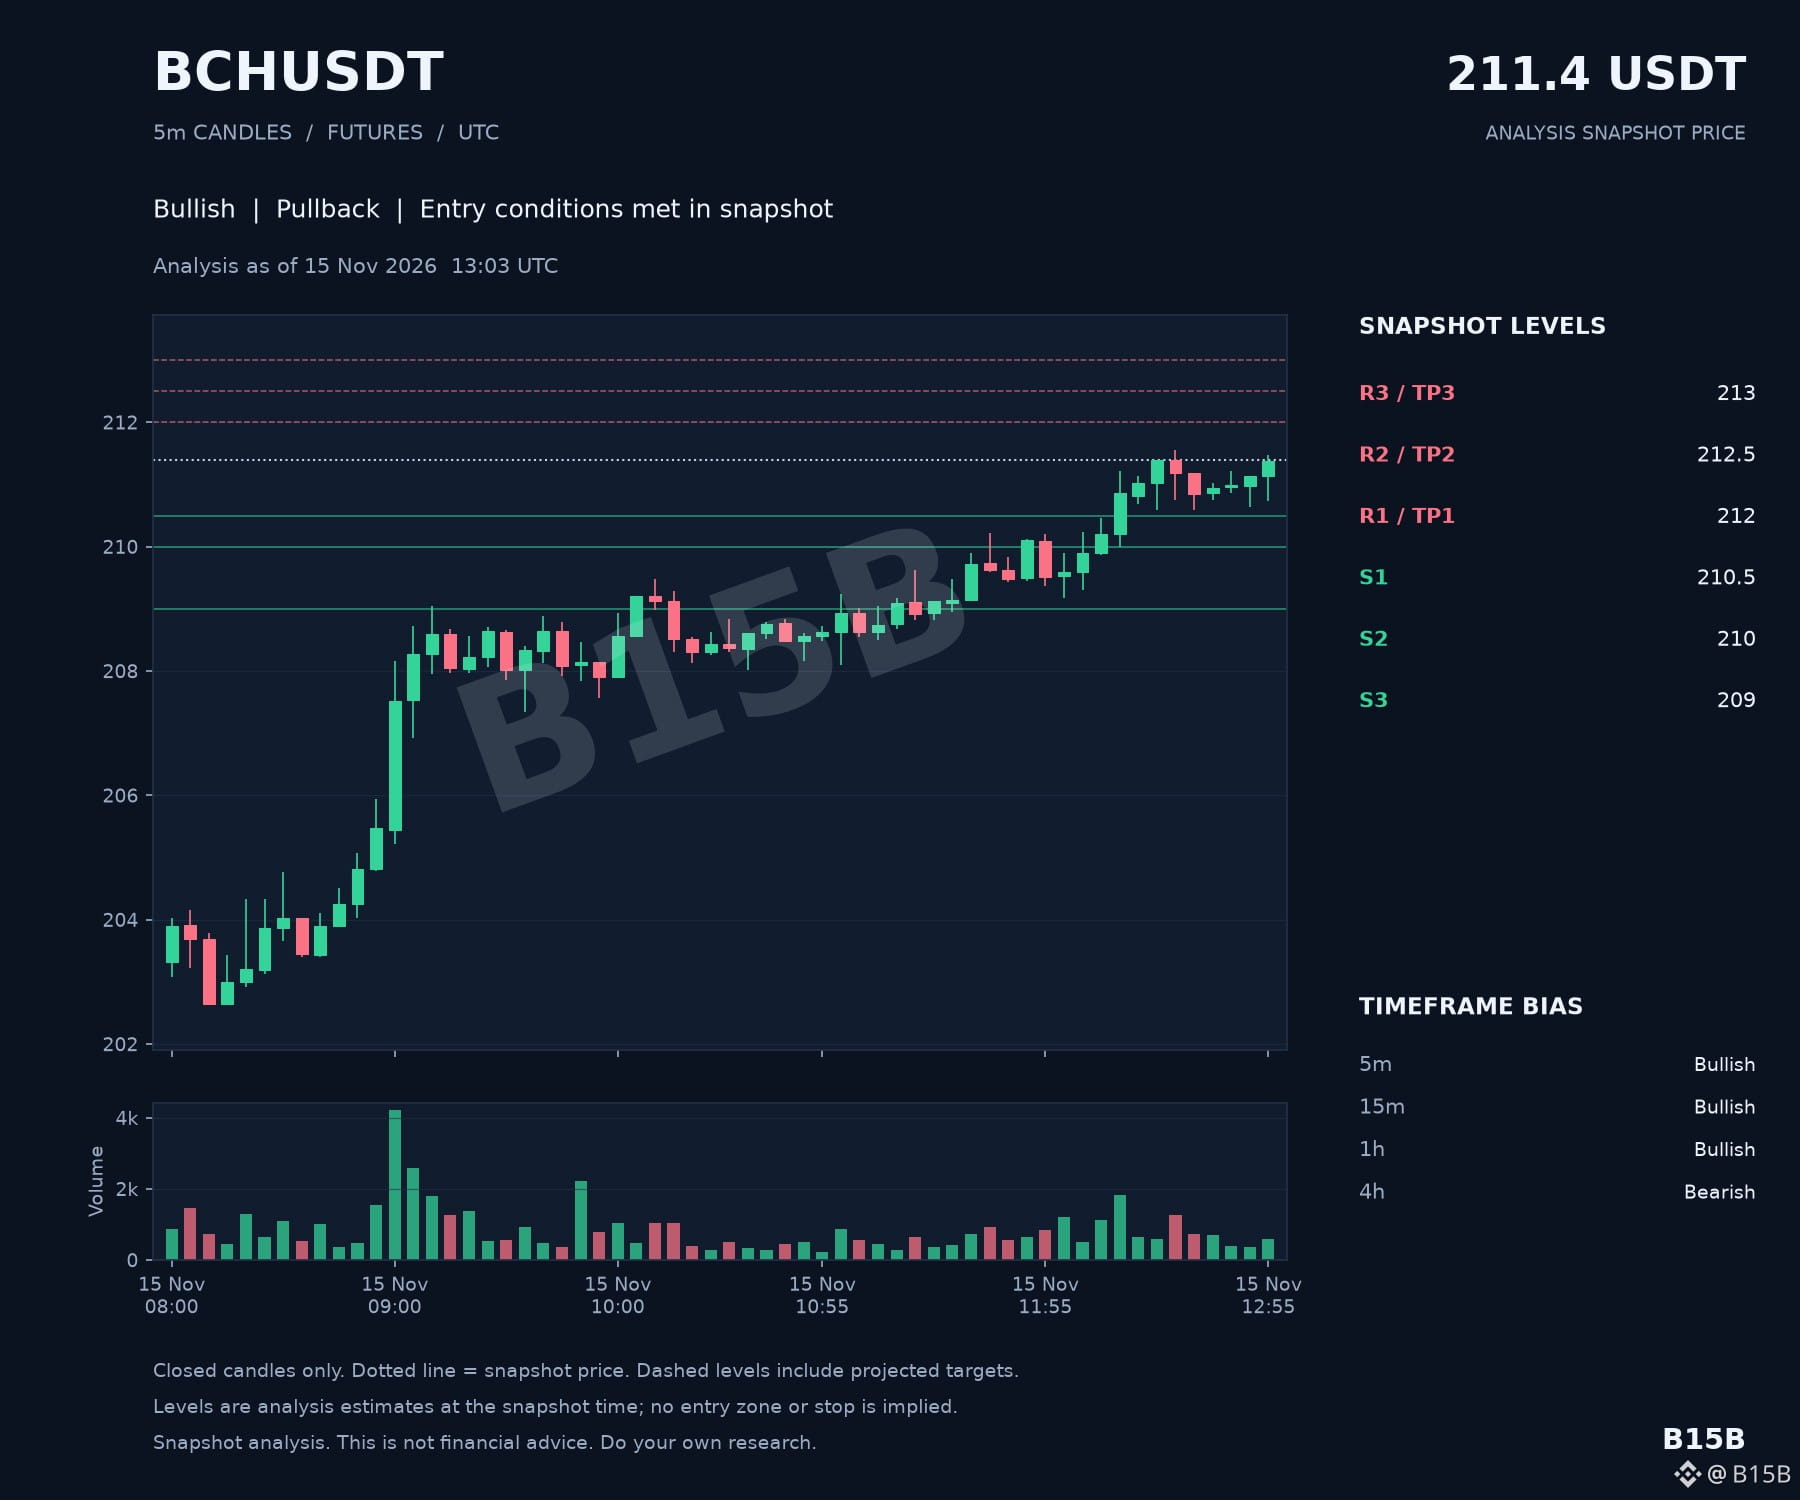
$BCH is putting in some solid intraday work, but we’re currently seeing a classic conflict between timeframes. While the immediate momentum across the 5-minute, 15-minute, and 1-hour charts has aligned into a bullish trend, the 4-hour chart is still holding a bearish bias, creating a bit of a "tug-of-war" for price direction.
We are observing a pullback setup with internal entry conditions being met around the 211.4 level. The bulls are clearly trying to reclaim ground, but they are running directly into a cluster of resistance levels just a few dollars above current prices.
- 📈 Bullish trend alignment on all timeframes under 4h.
- 🛡️ Key intraday support levels at 210.5 and 210.
- 🚧 Immediate resistance targets at 212 and 212.5.
- 🎯 Current pullback setup testing short-term buyer conviction.
Given that the 5-minute, 15-minute, and 1-hour charts are all showing bullish alignment, what specific price action at the 212 resistance would convince you that the 4-hour bearish trend is finally ready to flip?
#BCH #BitcoinCash #CryptoAnalysis #TechnicalAnalysis
$BCH is putting in some solid intraday work, but we’re currently seeing a classic conflict between timeframes. While the immediate momentum across the 5-minute, 15-minute, and 1-hour charts has aligned into a bullish trend, the 4-hour chart is still holding a bearish bias, creating a bit of a "tug-of-war" for price direction.
We are observing a pullback setup with internal entry conditions being met around the 211.4 level. The bulls are clearly trying to reclaim ground, but they are running directly into a cluster of resistance levels just a few dollars above current prices.
- 📈 Bullish trend alignment on all timeframes under 4h.
- 🛡️ Key intraday support levels at 210.5 and 210.
- 🚧 Immediate resistance targets at 212 and 212.5.
- 🎯 Current pullback setup testing short-term buyer conviction.
Given that the 5-minute, 15-minute, and 1-hour charts are all showing bullish alignment, what specific price action at the 212 resistance would convince you that the 4-hour bearish trend is finally ready to flip?
#BCH #BitcoinCash #CryptoAnalysis #TechnicalAnalysis
We are observing a pullback setup with internal entry conditions being met around the 211.4 level. The bulls are clearly trying to reclaim ground, but they are running directly into a cluster of resistance levels just a few dollars above current prices.
- 📈 Bullish trend alignment on all timeframes under 4h.
- 🛡️ Key intraday support levels at 210.5 and 210.
- 🚧 Immediate resistance targets at 212 and 212.5.
- 🎯 Current pullback setup testing short-term buyer conviction.
Given that the 5-minute, 15-minute, and 1-hour charts are all showing bullish alignment, what specific price action at the 212 resistance would convince you that the 4-hour bearish trend is finally ready to flip?
#BCH #BitcoinCash #CryptoAnalysis #TechnicalAnalysis
52
·
--
Рост
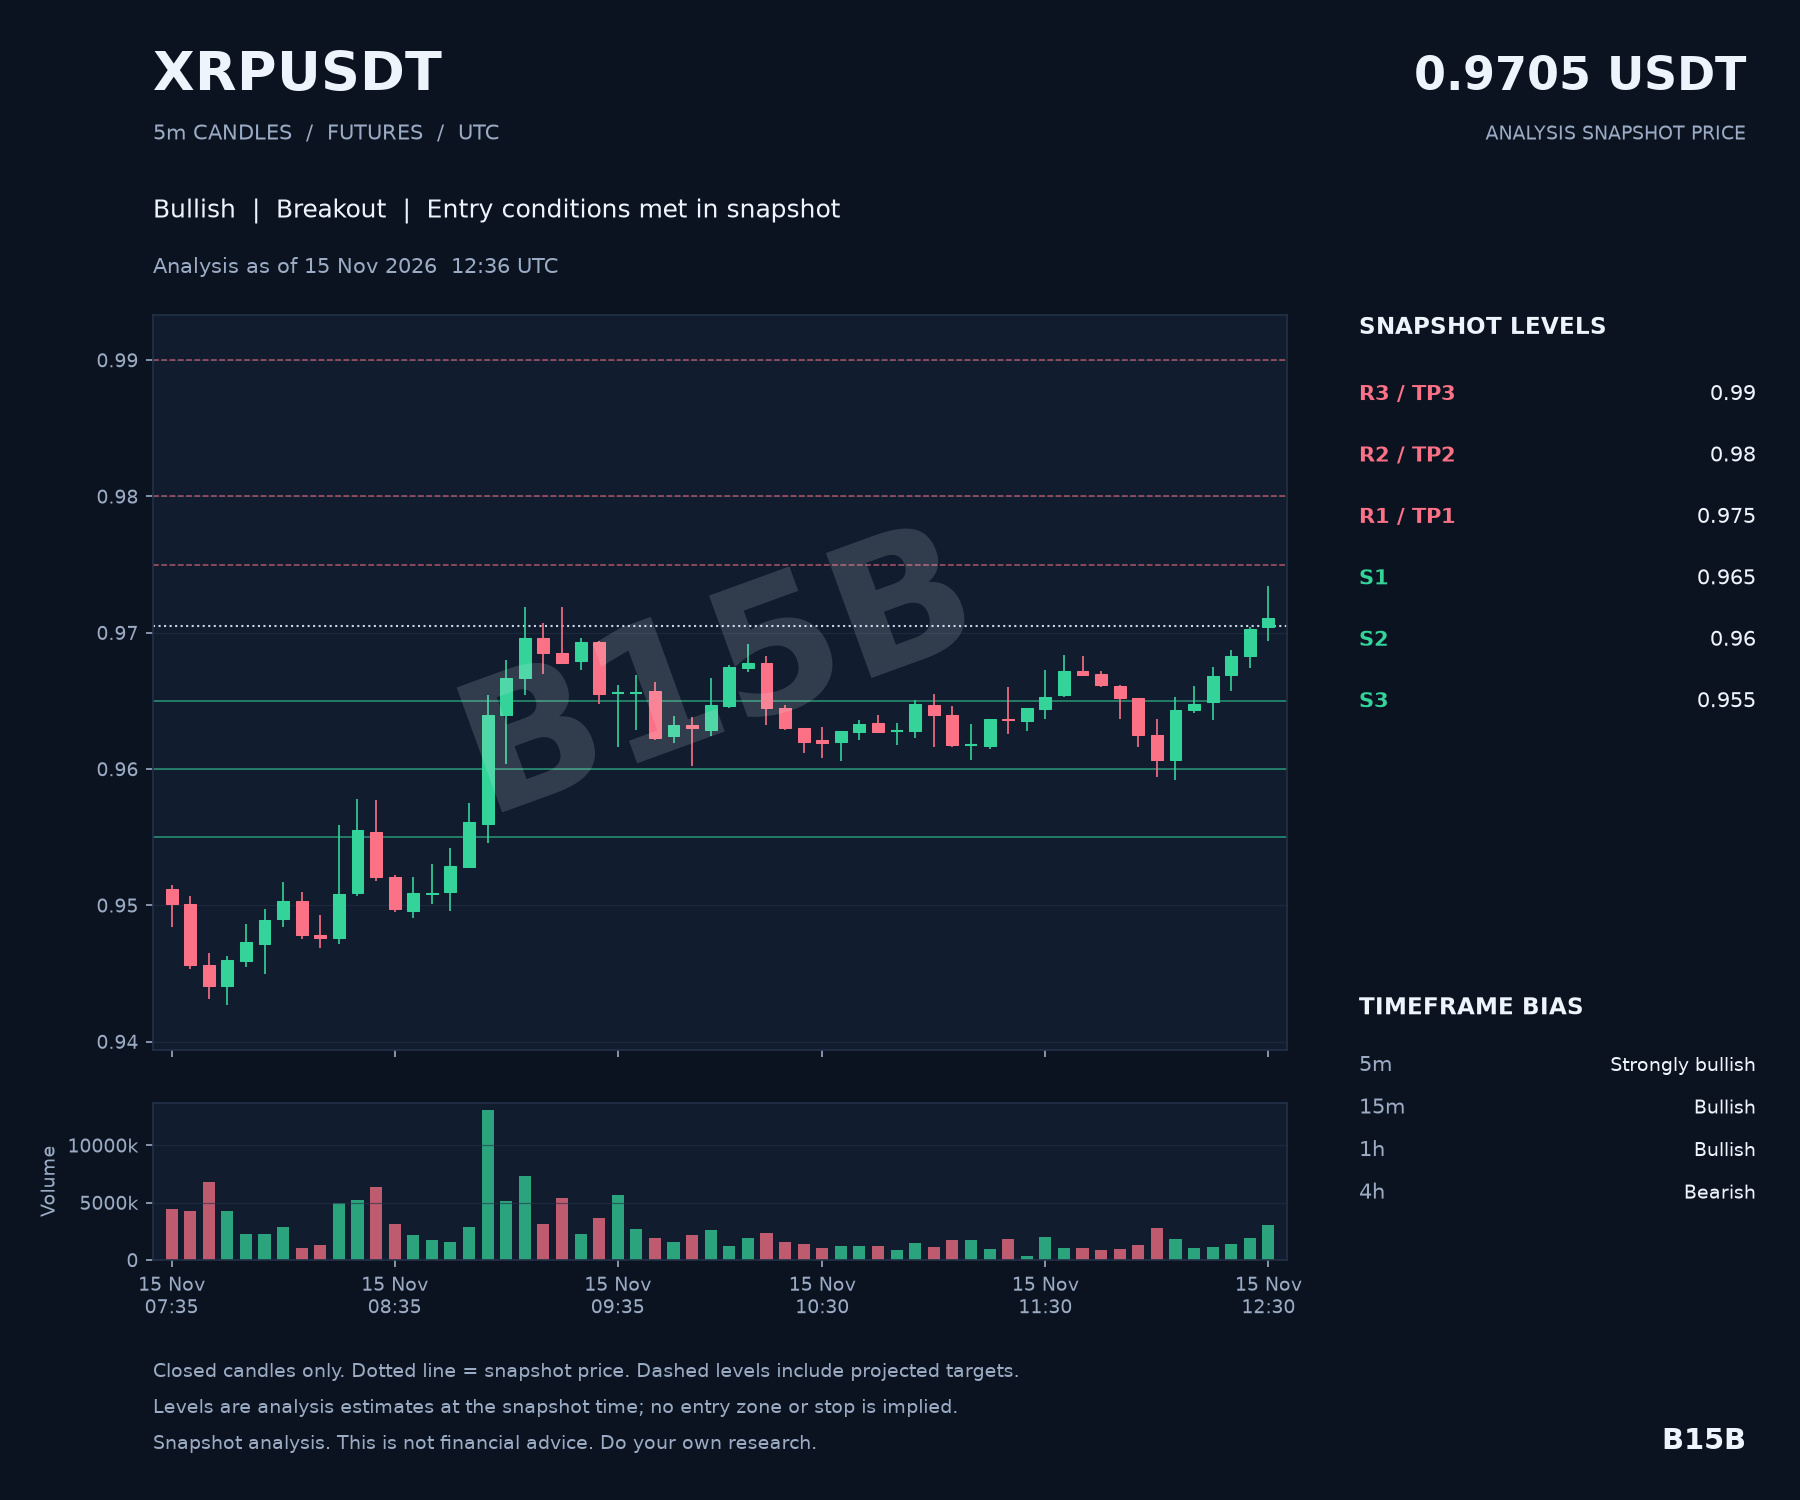
$XRP is showing some significant intraday heat right now. While the 4-hour trend still carries a bearish lean, the immediate momentum is looking increasingly aggressive. We are currently seeing a breakout setup where internal conditions have been met, with the 5-minute timeframe appearing "strongly bullish" as price hovers around $0.9705.
The technical structure is currently a bit of a tug-of-war. The micro-trends are clearly pushing higher, but they are doing so against a higher-timeframe resistance that hasn't fully cleared.
- 🚧 Resistance: 0.975, 0.98, and 0.99
- 🛡️ Support: 0.965, 0.96, and 0.955
- 📈 Trend: Strongly bullish (5m) to Bullish (1h)
- 🎯 Scenario Targets: 0.975, 0.98, and 0.99
How do you interpret the "strongly bullish" micro-timeframe strength when it’s running directly into a 4-hour bearish trend—does this look like the early stages of a genuine trend reversal or just a short-term volatility spike?
With targets sitting just under the $1.00 mark, the focus is on whether the 1-hour bullishness can eventually force a shift in that heavier 4-hour structure. ⚠️
#XRP #Crypto #TechnicalAnalysis #Altcoins
$XRP is showing some significant intraday heat right now. While the 4-hour trend still carries a bearish lean, the immediate momentum is looking increasingly aggressive. We are currently seeing a breakout setup where internal conditions have been met, with the 5-minute timeframe appearing "strongly bullish" as price hovers around $0.9705.
The technical structure is currently a bit of a tug-of-war. The micro-trends are clearly pushing higher, but they are doing so against a higher-timeframe resistance that hasn't fully cleared.
- 🚧 Resistance: 0.975, 0.98, and 0.99
- 🛡️ Support: 0.965, 0.96, and 0.955
- 📈 Trend: Strongly bullish (5m) to Bullish (1h)
- 🎯 Scenario Targets: 0.975, 0.98, and 0.99
How do you interpret the "strongly bullish" micro-timeframe strength when it’s running directly into a 4-hour bearish trend—does this look like the early stages of a genuine trend reversal or just a short-term volatility spike?
With targets sitting just under the $1.00 mark, the focus is on whether the 1-hour bullishness can eventually force a shift in that heavier 4-hour structure. ⚠️
#XRP #Crypto #TechnicalAnalysis #Altcoins
The technical structure is currently a bit of a tug-of-war. The micro-trends are clearly pushing higher, but they are doing so against a higher-timeframe resistance that hasn't fully cleared.
- 🚧 Resistance: 0.975, 0.98, and 0.99
- 🛡️ Support: 0.965, 0.96, and 0.955
- 📈 Trend: Strongly bullish (5m) to Bullish (1h)
- 🎯 Scenario Targets: 0.975, 0.98, and 0.99
How do you interpret the "strongly bullish" micro-timeframe strength when it’s running directly into a 4-hour bearish trend—does this look like the early stages of a genuine trend reversal or just a short-term volatility spike?
With targets sitting just under the $1.00 mark, the focus is on whether the 1-hour bullishness can eventually force a shift in that heavier 4-hour structure. ⚠️
#XRP #Crypto #TechnicalAnalysis #Altcoins
1
93
·
--
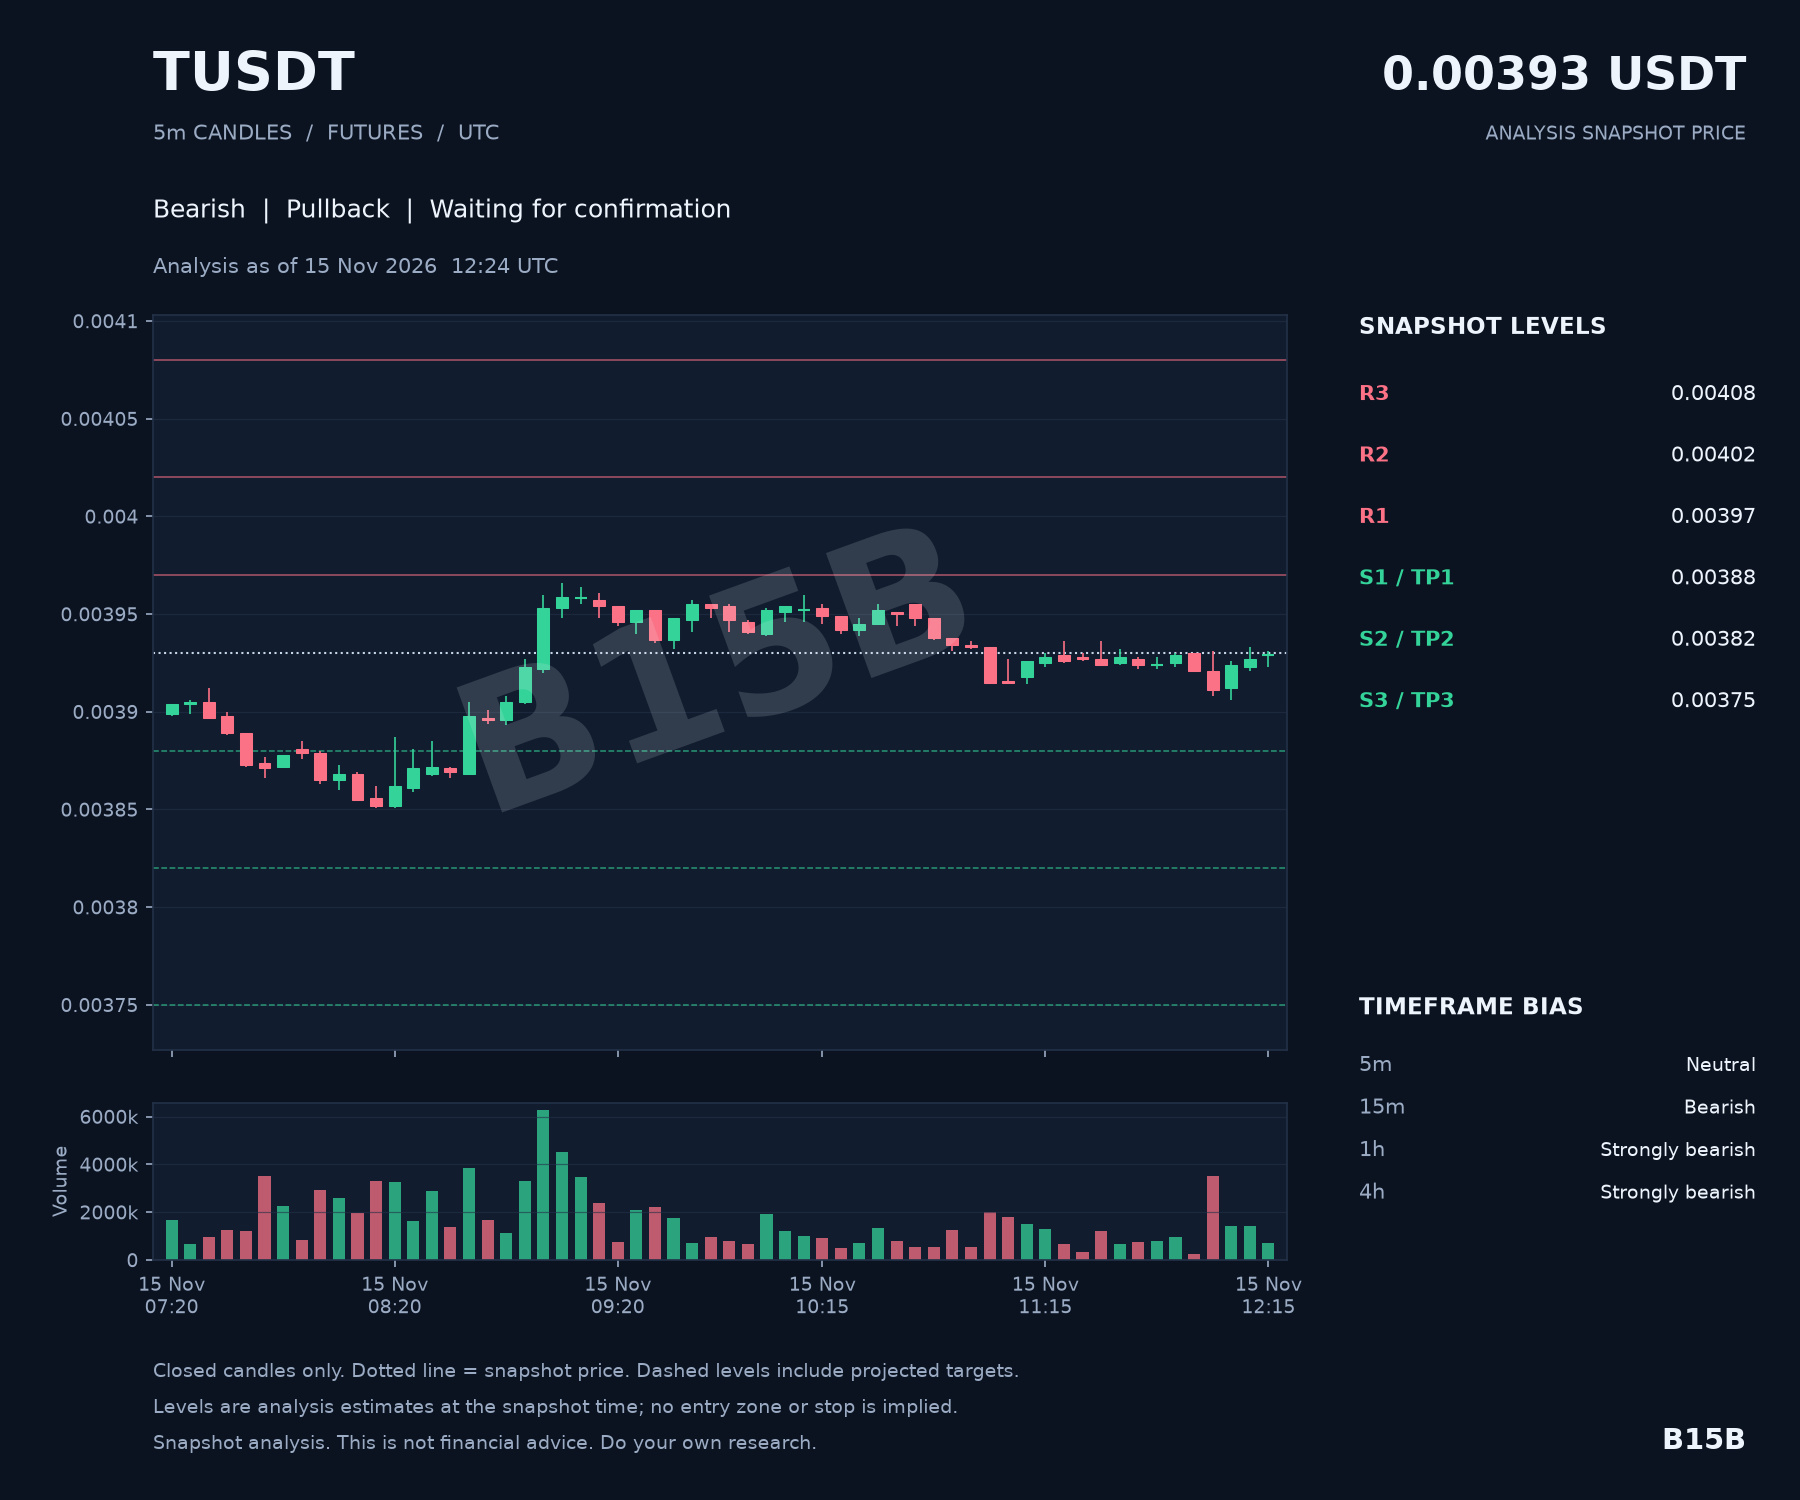
The technical outlook for $T is currently looking quite heavy. While the micro 5-minute timeframe is showing a bit of neutral consolidation, the broader trend is leaning decisively to the downside. Both the 1-hour and 4-hour charts are reporting strongly bearish conditions, suggesting that the current "pullback" setup is facing significant overhead pressure.
With the price sitting at $0.00393, the immediate focus is on whether the first line of support at $0.00388 can hold. If that level fails to provide a floor, the bearish scenario targets extend down toward $0.00382 and $0.00375. On the flip side, any attempt at a recovery faces a cluster of resistance starting at $0.00397 and $0.00402.
Given that the ultra-short-term 5-minute chart is the only timeframe not currently showing a bearish bias, what specific price action or volume changes would you need to see within this neutral window to suggest that a trend reversal is more likely than a continuation toward the lower targets?
We are currently waiting for entry confirmation on this setup, as the trend remains firmly bearish across the majority of timeframes.
#Threshold #CryptoAnalysis #TechnicalAnalysis #TradingView #Altcoins $T
The technical outlook for $T is currently looking quite heavy. While the micro 5-minute timeframe is showing a bit of neutral consolidation, the broader trend is leaning decisively to the downside. Both the 1-hour and 4-hour charts are reporting strongly bearish conditions, suggesting that the current "pullback" setup is facing significant overhead pressure.
With the price sitting at $0.00393, the immediate focus is on whether the first line of support at $0.00388 can hold. If that level fails to provide a floor, the bearish scenario targets extend down toward $0.00382 and $0.00375. On the flip side, any attempt at a recovery faces a cluster of resistance starting at $0.00397 and $0.00402.
Given that the ultra-short-term 5-minute chart is the only timeframe not currently showing a bearish bias, what specific price action or volume changes would you need to see within this neutral window to suggest that a trend reversal is more likely than a continuation toward the lower targets?
We are currently waiting for entry confirmation on this setup, as the trend remains firmly bearish across the majority of timeframes.
#Threshold #CryptoAnalysis #TechnicalAnalysis #TradingView #Altcoins $T
With the price sitting at $0.00393, the immediate focus is on whether the first line of support at $0.00388 can hold. If that level fails to provide a floor, the bearish scenario targets extend down toward $0.00382 and $0.00375. On the flip side, any attempt at a recovery faces a cluster of resistance starting at $0.00397 and $0.00402.
Given that the ultra-short-term 5-minute chart is the only timeframe not currently showing a bearish bias, what specific price action or volume changes would you need to see within this neutral window to suggest that a trend reversal is more likely than a continuation toward the lower targets?
We are currently waiting for entry confirmation on this setup, as the trend remains firmly bearish across the majority of timeframes.
#Threshold #CryptoAnalysis #TechnicalAnalysis #TradingView #Altcoins $T
19
·
--
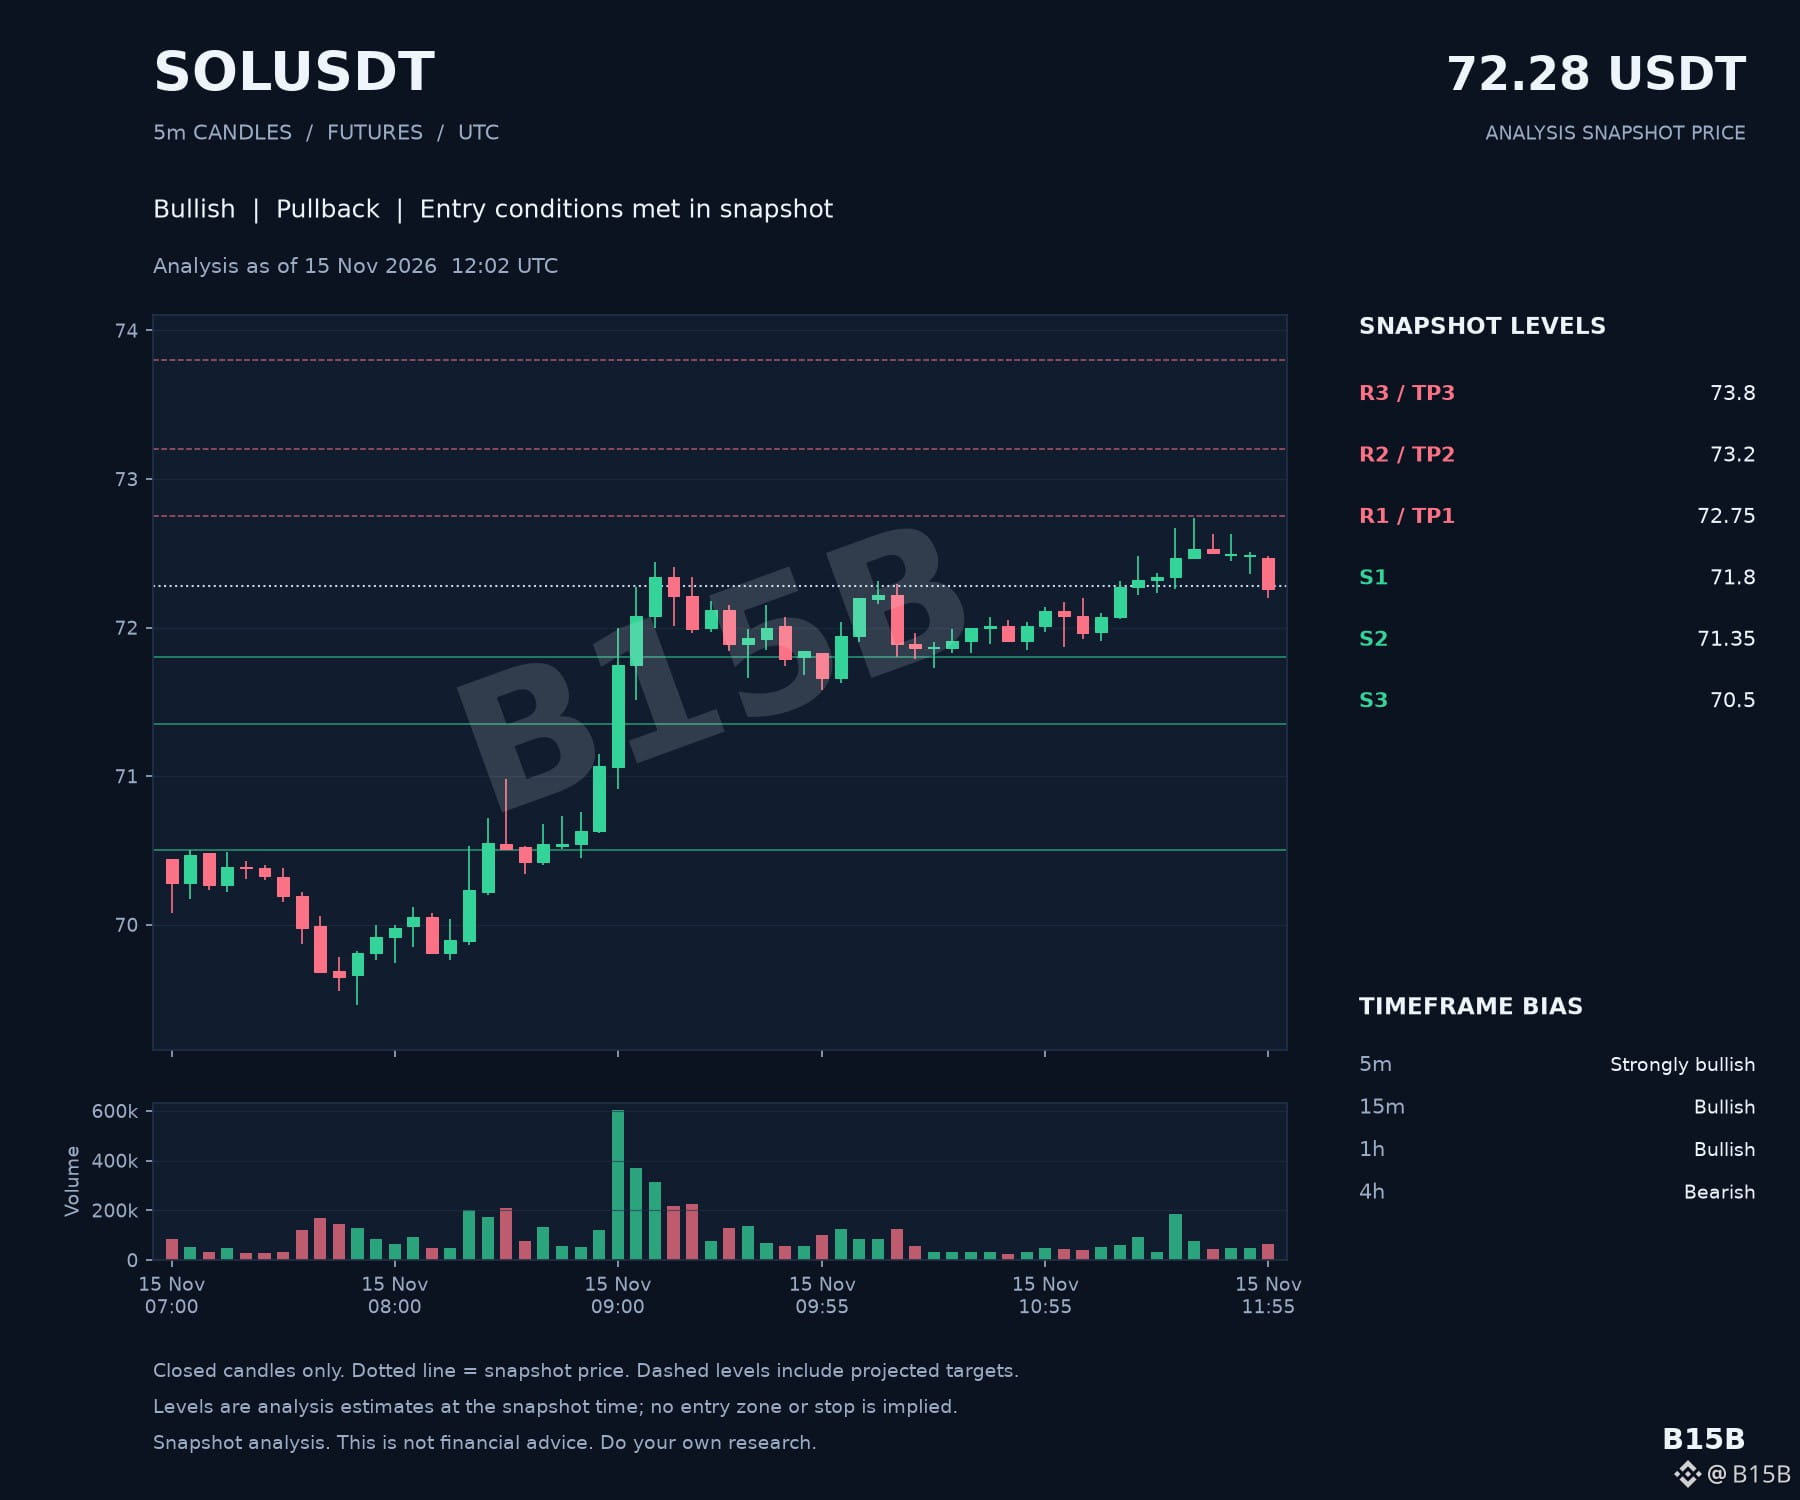
$SOL is showing some significant intraday heat. Despite the 4h trend still leaning bearish, the immediate momentum is looking increasingly aggressive. We are currently seeing a pullback setup with the price sitting at 72.28, while the 5m, 15m, and 1h timeframes have all aligned into bullish territory.
The short-term strength is undeniable here, and the internal conditions for a move higher are starting to take shape. If this momentum sustains, the immediate path leads toward resistance levels at 72.75 and 73.2, with 73.8 being the next major milestone for the bulls to reclaim.
On the flip side, keep a close eye on the 71.8 support zone. For this bullish structure to remain intact, we want to see that floor hold. It’s a classic tug-of-war between strong lower-timeframe pressure and the lingering bearishness on the 4h chart—definitely one to watch closely as it develops.
$SOL is showing some significant intraday heat. Despite the 4h trend still leaning bearish, the immediate momentum is looking increasingly aggressive. We are currently seeing a pullback setup with the price sitting at 72.28, while the 5m, 15m, and 1h timeframes have all aligned into bullish territory.
The short-term strength is undeniable here, and the internal conditions for a move higher are starting to take shape. If this momentum sustains, the immediate path leads toward resistance levels at 72.75 and 73.2, with 73.8 being the next major milestone for the bulls to reclaim.
On the flip side, keep a close eye on the 71.8 support zone. For this bullish structure to remain intact, we want to see that floor hold. It’s a classic tug-of-war between strong lower-timeframe pressure and the lingering bearishness on the 4h chart—definitely one to watch closely as it develops.
The short-term strength is undeniable here, and the internal conditions for a move higher are starting to take shape. If this momentum sustains, the immediate path leads toward resistance levels at 72.75 and 73.2, with 73.8 being the next major milestone for the bulls to reclaim.
On the flip side, keep a close eye on the 71.8 support zone. For this bullish structure to remain intact, we want to see that floor hold. It’s a classic tug-of-war between strong lower-timeframe pressure and the lingering bearishness on the 4h chart—definitely one to watch closely as it develops.
46
Войдите, чтобы посмотреть больше материала
Присоединяйтесь к пользователям криптовалют по всему миру на Binance Square
⚡️ Получайте новейшую и полезную информацию о криптоактивах.
💬 Нам доверяет крупнейшая в мире криптобиржа.
👍 Получите достоверные аналитические данные от верифицированных создателей контента.
Эл. почта/номер телефона
В тренде
CryptoSelloffTriggersMultipleWhaleLiquidations
Просмотров: 150,175
1,630 обсуждают
Crypto Liquidations Top $2B in 24 Hours as 329,000 Traders Are Wiped Out
Binance News
·Лайков: 39
·Просмотров: 48.1k
USSpotXRPETFsSeeLargestWeeklyOutflowIn8Months
Просмотров: 140,908
1,477 обсуждают
WillFOMCMinutesReinforceRateHikeExpectations?
Просмотров: 39,145
682 обсуждают