Bitcoin at $65,500: Is a Rebound Taking Shape After the Sharp Drop?
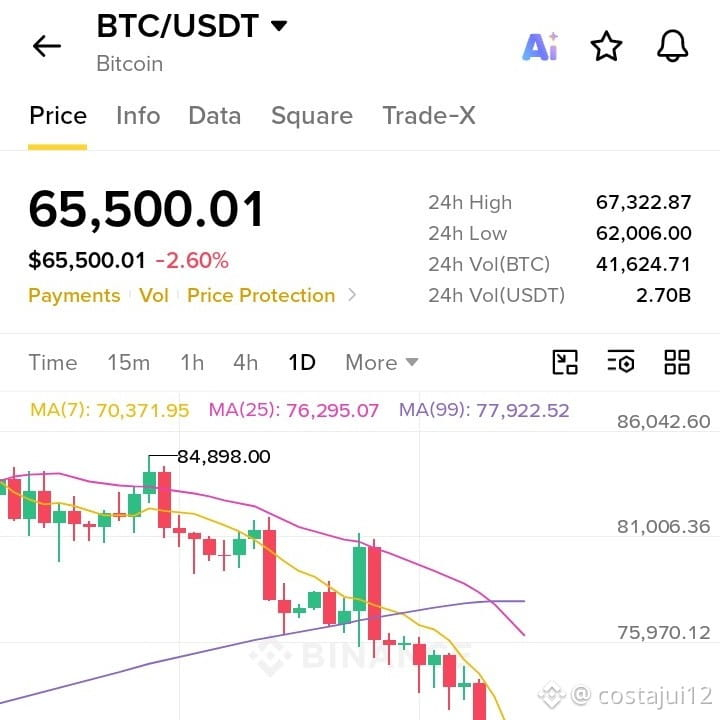
BTC/USDT is trading at $65,500.01, down 2.60% over 24 hours. The 24h high is $67,322.87 and the low is $62,006.00, with volume around 41,624 BTC (2.70B USDT).
Big picture (Daily chart):
BTC has fallen sharply from its recent high of $84,898. It's down 20.55% over 30 days and 31.63% over the past year. Price is trading below the MA(7), MA(25) and MA(99), so the broader trend remains bearish.
Positive signs:
After a heavy red candle, price tapped $62,006 and left a long lower wick, with the current candle turning green. That suggests buyers stepped in around the $62K zone. Volume also spiked during this drop, which can sometimes signal the late stage of panic selling.
Key levels:
Support: $62,006 (24h low), then the $60,800 area
Resistance: $67,300, then $70,900 (near the MA(7) at ~$70,371)
Takeaways for traders:
Avoid catching a falling knife; wait for confirmation.
A daily close below $62K raises the risk of further downside.
A break above $67.3K could strengthen a short-term rebound.
Never trade without a stop-loss, and only risk what you can afford to lose.
This is not financial advice. Do your own research (DYOR).
What's your view? Will $62K hold as strong support? Let me know in the comments 👇
#Bitcoin #BTC #BTCUSDT #BinanceSquare #Crypto $BTC
BTC/USDT is trading at $65,500.01, down 2.60% over 24 hours. The 24h high is $67,322.87 and the low is $62,006.00, with volume around 41,624 BTC (2.70B USDT).
Big picture (Daily chart):
BTC has fallen sharply from its recent high of $84,898. It's down 20.55% over 30 days and 31.63% over the past year. Price is trading below the MA(7), MA(25) and MA(99), so the broader trend remains bearish.
Positive signs:
After a heavy red candle, price tapped $62,006 and left a long lower wick, with the current candle turning green. That suggests buyers stepped in around the $62K zone. Volume also spiked during this drop, which can sometimes signal the late stage of panic selling.
Key levels:
Support: $62,006 (24h low), then the $60,800 area
Resistance: $67,300, then $70,900 (near the MA(7) at ~$70,371)
Takeaways for traders:
Avoid catching a falling knife; wait for confirmation.
A daily close below $62K raises the risk of further downside.
A break above $67.3K could strengthen a short-term rebound.
Never trade without a stop-loss, and only risk what you can afford to lose.
This is not financial advice. Do your own research (DYOR).
What's your view? Will $62K hold as strong support? Let me know in the comments 👇
#Bitcoin #BTC #BTCUSDT #BinanceSquare #Crypto $BTC