
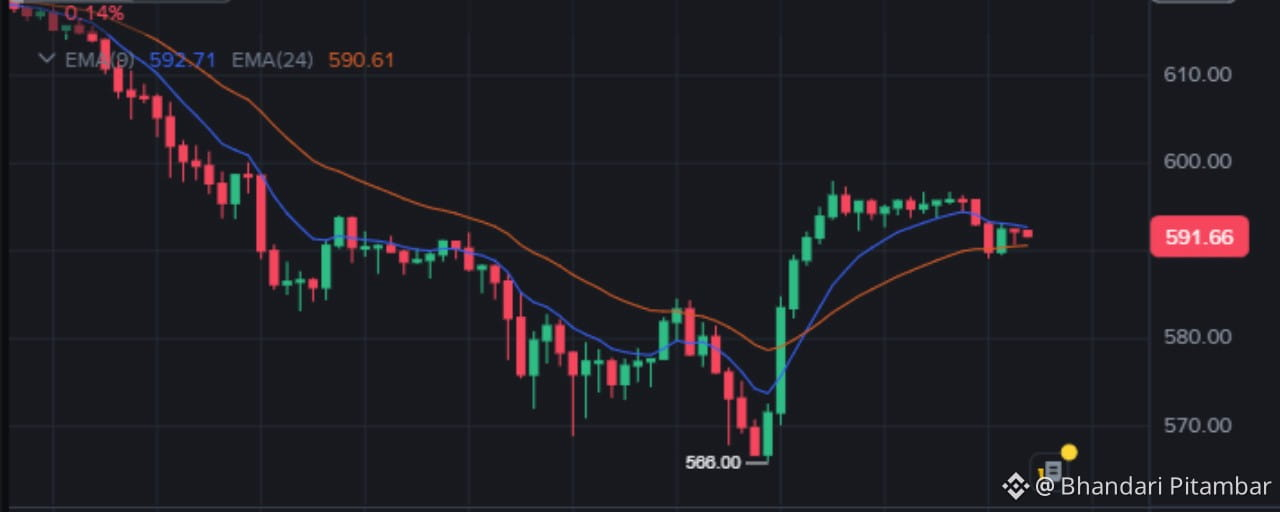

What Your Chart Shows:
Price: 591.66 — BNB bounced sharply in a V-shape from the low of 568 to around 597. It is now pulling back and trying to stabilize.
EMA(9) = 592.71 (price is below it) and EMA(24) = 590.61 (price is above it) — Price is trapped between the two EMAs, indicating that the market is looking for direction.
RSI(6) = 43 — Buying momentum is slowing down, but the market is not oversold. RSI is in a neutral-to-weak zone.
Bigger Picture (Very Important):
Looking only at the 15-minute chart is not enough. On higher timeframes, BNB is in a strong downtrend.
BNB has dropped approximately 15% in 7 days, falling from around 700 to 590.
This is not just a BNB problem — the entire crypto market is under pressure: Bitcoin is below 69,000, ETH is below 2,000, and approximately $1.9 billion in liquidations have occurred within 24 hours.
Macroeconomic pressure: Higher-than-expected US inflation has increased fears that the Federal Reserve may raise interest rates in December. ETF outflows are also putting pressure on the market.
The impact of Binance's approximately $6.4 billion hack on October 29 is still being felt. However, Binance has reportedly covered all affected assets through its SAFU fund and published its Proof of Reserves.
Fear & Greed Index = 21 (Extreme Fear), and approximately 71% of accounts are holding long positions. Heavy long positioning increases the risk of further liquidations.
Pump or Dump? — Both Scenarios:
🟢 Bullish Scenario (Pump):
If the 588–590 support zone (EMA24) holds and BNB breaks above 595–597 with strong volume, the next targets could be:
600–605
610–613 (potential relief rally)
The daily RSI was around 28 (oversold), so there is room for a bounce.
However, the rally may not last unless BTC also stabilizes and starts recovering.
🔴 Bearish Scenario (Dump) — More Likely According to the Current Trend:
If the price drops below 588–590, BNB could retest:
580 support
568 (the previous chart low)
If 568 also breaks, the next downside zone could be 550–558.
Analysts consider $580 an important support level. Losing this level could lead to a deeper decline.
My Conclusion:
In the short term, BNB appears likely to move within the 568–600 range, but the overall trend remains bearish.
Buying the current bounce and assuming that a new pump has started would be risky.
Until BTC recovers and BNB successfully reclaims the 600+ level, this move is more likely to be an oversold relief bounce rather than the beginning of a sustained bullish trend.
If 568 holds, a short-term long scalp setup may develop, but only with strict risk management and a stop-loss around 566–567.

