🔥 $DOGE Technical Update: Key Levels & Momentum Breakdown
📊 1. Market Snapshot
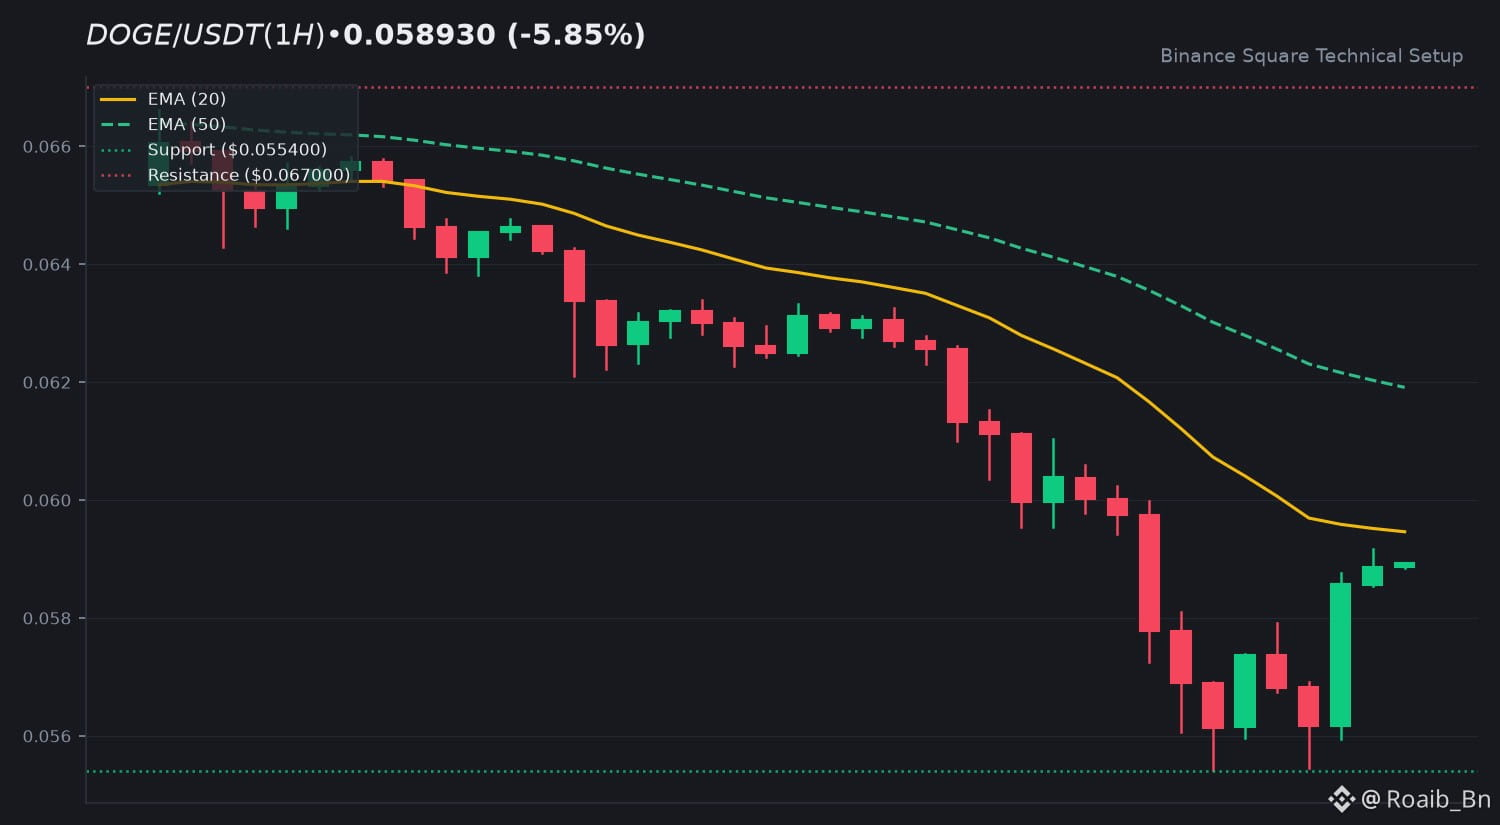
The current price for $DOGE is 0.0589 USDT, reflecting a 24h change of -5.85%. Trading activity remains characterized by low volume, with the 24h quote volume at approximately 85.97 million USDT. This indicates a period of consolidation with relatively weak market conviction compared to the 20-SMA.
📈 2. Technical Momentum & Indicator Bias
Price action for $DOGE is currently trading below both the EMA 20 at 0.0595 and the EMA 50 at 0.0619, confirming a prevailing downtrend on the current timeframe. The RSI sits at 42.89, suggesting a neutral to slightly bearish stance, as it has yet to reach oversold territory. The MACD histogram shows a marginal positive value of +0.0001, though the MACD line and signal line remain in negative territory, highlighting the lack of strong bullish momentum.
🎯 3. Key Technical Levels to Watch
• 🟢 Resistance Zone: 0.0670 followed by 0.0696.
• 🔴 Support Zone: 0.0554 serves as the immediate floor.
• 🛡️ Pivot Confluence: The 0.0595 level (EMA 20) acts as a primary pivot for short-term sentiment shifts.
💡 4. Technical Takeaway & Risk Management
The current price structure suggests that $DOGE is testing lower bounds. Traders often monitor the interaction between price and the EMA 20/50 cluster to identify potential trend reversals or continued consolidation. Observing volume spikes during retests of the 0.0554 support level will be essential for determining if current demand is sufficient to initiate a recovery phase.
💬 5. Community Discussion
What is your technical outlook for $DOGE this week? Are you accumulating or waiting for confirmation? Drop your thoughts below! 👇
⚠️ 6. Disclaimer
Educational technical analysis only. Not financial advice (NFA). Crypto markets involve risk. Always DYOR.
$DOGE #DOGE #BinanceSquare
📊 1. Market Snapshot
The current price for $DOGE is 0.0589 USDT, reflecting a 24h change of -5.85%. Trading activity remains characterized by low volume, with the 24h quote volume at approximately 85.97 million USDT. This indicates a period of consolidation with relatively weak market conviction compared to the 20-SMA.
📈 2. Technical Momentum & Indicator Bias
Price action for $DOGE is currently trading below both the EMA 20 at 0.0595 and the EMA 50 at 0.0619, confirming a prevailing downtrend on the current timeframe. The RSI sits at 42.89, suggesting a neutral to slightly bearish stance, as it has yet to reach oversold territory. The MACD histogram shows a marginal positive value of +0.0001, though the MACD line and signal line remain in negative territory, highlighting the lack of strong bullish momentum.
🎯 3. Key Technical Levels to Watch
• 🟢 Resistance Zone: 0.0670 followed by 0.0696.
• 🔴 Support Zone: 0.0554 serves as the immediate floor.
• 🛡️ Pivot Confluence: The 0.0595 level (EMA 20) acts as a primary pivot for short-term sentiment shifts.
💡 4. Technical Takeaway & Risk Management
The current price structure suggests that $DOGE is testing lower bounds. Traders often monitor the interaction between price and the EMA 20/50 cluster to identify potential trend reversals or continued consolidation. Observing volume spikes during retests of the 0.0554 support level will be essential for determining if current demand is sufficient to initiate a recovery phase.
💬 5. Community Discussion
What is your technical outlook for $DOGE this week? Are you accumulating or waiting for confirmation? Drop your thoughts below! 👇
⚠️ 6. Disclaimer
Educational technical analysis only. Not financial advice (NFA). Crypto markets involve risk. Always DYOR.
$DOGE #DOGE #BinanceSquare