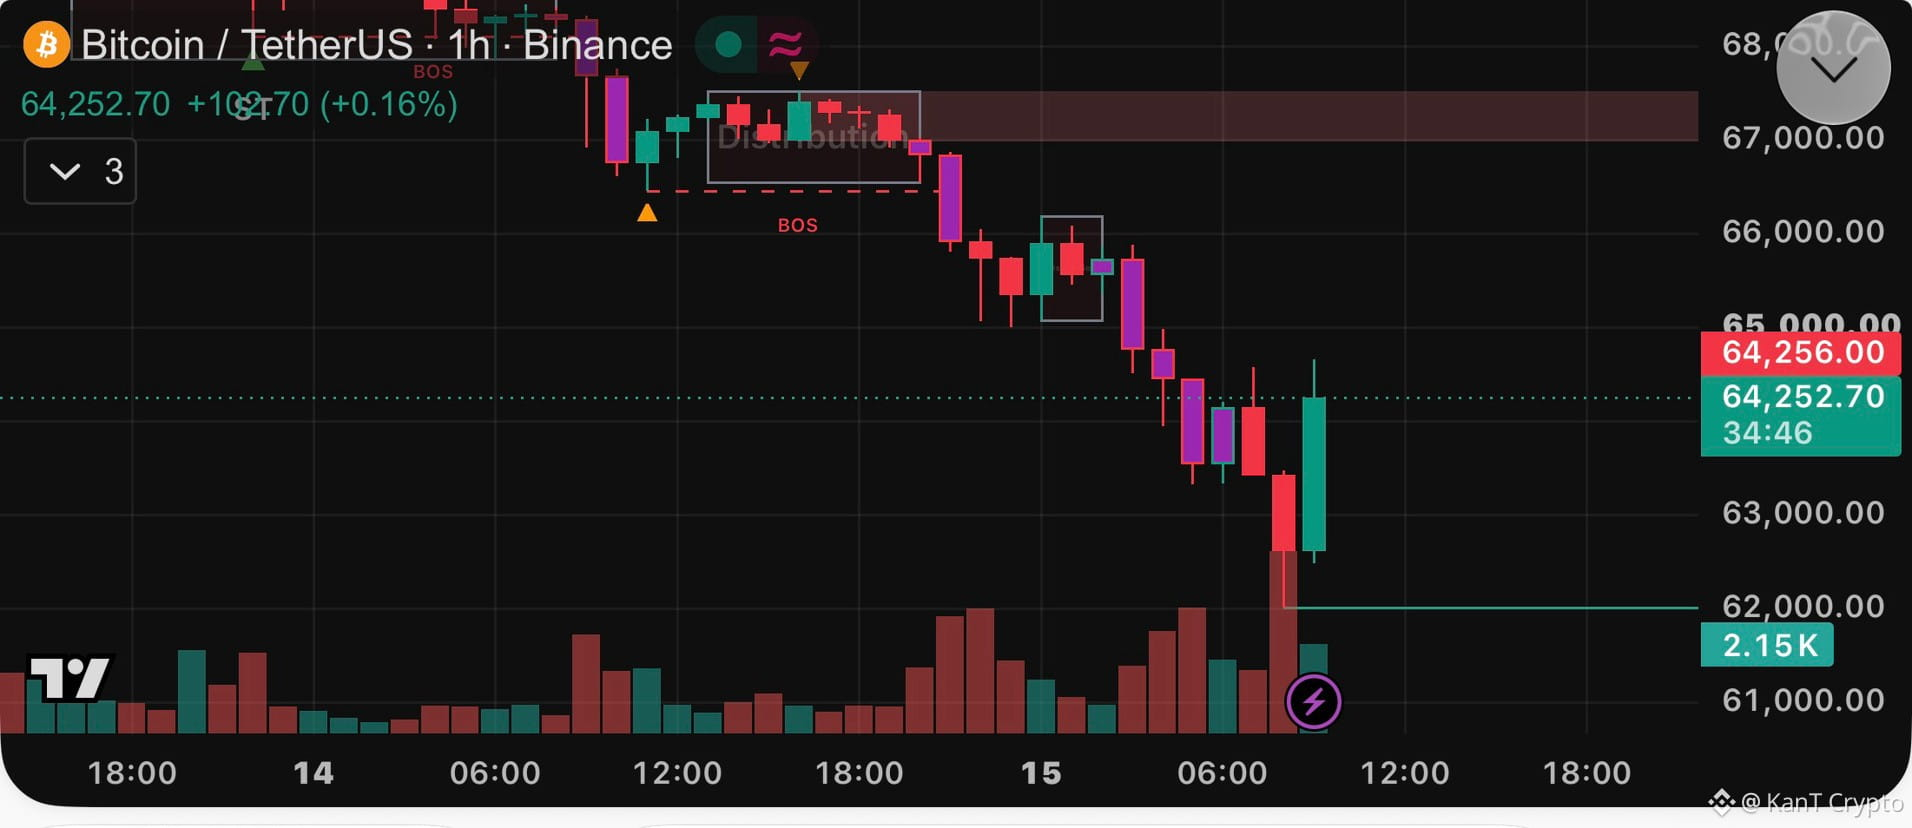
🩸 $1.96B in liquidations. Bitcoin under $62K. Then a $1,600 green candle out of nowhere.
Crypto's weekend from hell, in one chart.
Low: ~$61.98K
Now: $64,252
24h liquidations: $1.96B, BTC longs $645M vs shorts $62M
ETH and SOL: both down 10%+ on the day
Yesterday's map: lose $66.4K and nothing big is marked until the $57.7K cycle low.
Saturday's $65K to $66.1K box broke overnight, and the stairs went straight down. 📉
Then the chart did something interesting.
The final flush to $62K came on the biggest volume bar on the chart.
The very next hour erased the last three candles, wicked to $64.6K and closed near the top.
That's what a selling climax can look like: forced sellers run out, shorts rush to cover, and price snaps back.
Can, not does.
One candle isn't a bottom.
A real selling climax needs a retest that holds above the low.
Hold $62K on the retest → this was the flush, and the $65K to $66.1K box is the next ceiling.
Lose $62K → the snapback was a dead cat, and $57.7K is the next marked floor. 👀
And unless Bitcoin finds 6% by tonight's weekly close (UTC), the week ends well under the 200W near $68K.
Snapbacks after a liquidation cascade are the fastest way to get chopped twice. Wait for the retest, then decide.
Selling climax at $62K, or a dead cat before $57.7K?
Not financial advice.
$BTC
$ETH
$SOL
Crypto's weekend from hell, in one chart.
Low: ~$61.98K
Now: $64,252
24h liquidations: $1.96B, BTC longs $645M vs shorts $62M
ETH and SOL: both down 10%+ on the day
Yesterday's map: lose $66.4K and nothing big is marked until the $57.7K cycle low.
Saturday's $65K to $66.1K box broke overnight, and the stairs went straight down. 📉
Then the chart did something interesting.
The final flush to $62K came on the biggest volume bar on the chart.
The very next hour erased the last three candles, wicked to $64.6K and closed near the top.
That's what a selling climax can look like: forced sellers run out, shorts rush to cover, and price snaps back.
Can, not does.
One candle isn't a bottom.
A real selling climax needs a retest that holds above the low.
Hold $62K on the retest → this was the flush, and the $65K to $66.1K box is the next ceiling.
Lose $62K → the snapback was a dead cat, and $57.7K is the next marked floor. 👀
And unless Bitcoin finds 6% by tonight's weekly close (UTC), the week ends well under the 200W near $68K.
Snapbacks after a liquidation cascade are the fastest way to get chopped twice. Wait for the retest, then decide.
Selling climax at $62K, or a dead cat before $57.7K?
Not financial advice.
$BTC
$ETH
$SOL