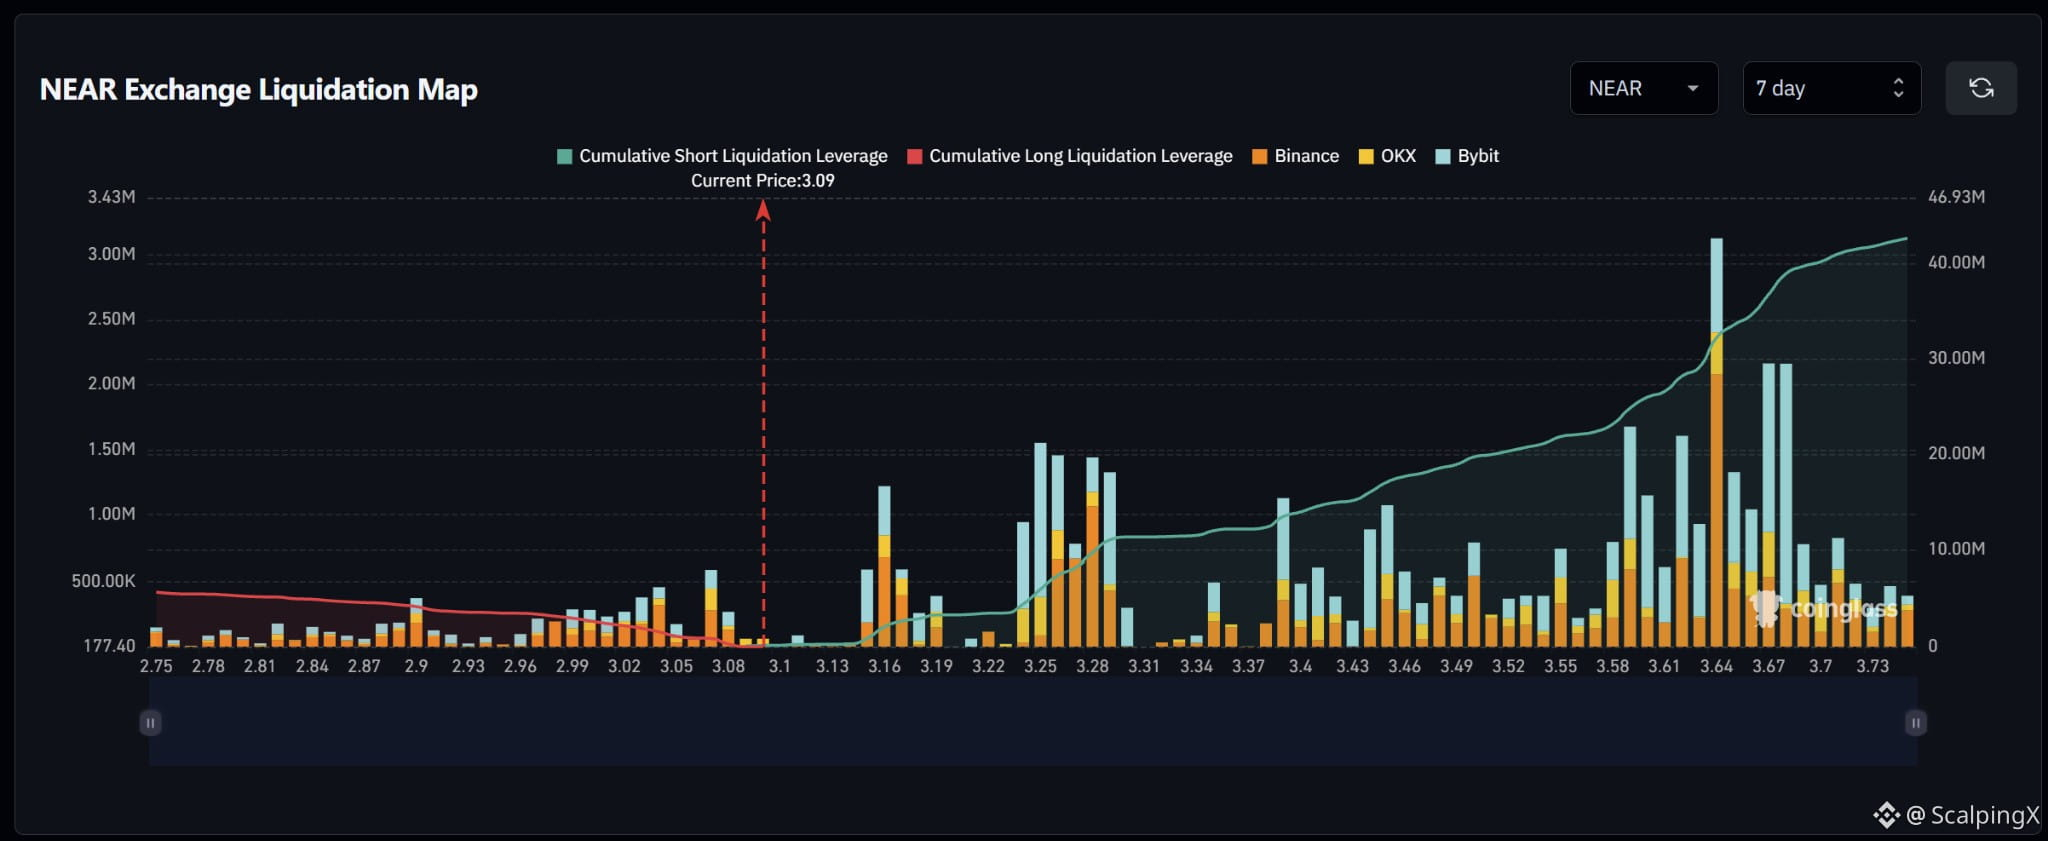
$NEAR – Liquidation Map (7 days) – Index ~3.09
🧭 The preferred scenario is a nearby long-liquidation sweep at 3.06–3.08. Estimated cumulative short exposure is substantially larger, but significant clusters sit farther away at 3.15–3.17, 3.24–3.29 and 3.59–3.68.
🔻 Losing 3.06 without a reclaim would shift focus to 3.03–3.05, followed by 2.98–3.02. Long-liquidation bars below are smaller, making sustained downside momentum after the initial sweep important.
🎯 Below 2.97, long clusters are scattered, with a more noticeable concentration around 2.89–2.90. A sweep of 3.06–3.08 followed by a quick reclaim of 3.09 would weaken bearish continuation.
⚖️ Holding above 3.17 after sweeping the first short cluster would shift focus to 3.24–3.29, across relatively thin exposure at 3.19–3.23. Holding above 3.29 would bring 3.39–3.45 into view; farther out sits 3.59–3.68, with the map’s largest bar near 3.64.
#LiquidationMap
🧭 The preferred scenario is a nearby long-liquidation sweep at 3.06–3.08. Estimated cumulative short exposure is substantially larger, but significant clusters sit farther away at 3.15–3.17, 3.24–3.29 and 3.59–3.68.
🔻 Losing 3.06 without a reclaim would shift focus to 3.03–3.05, followed by 2.98–3.02. Long-liquidation bars below are smaller, making sustained downside momentum after the initial sweep important.
🎯 Below 2.97, long clusters are scattered, with a more noticeable concentration around 2.89–2.90. A sweep of 3.06–3.08 followed by a quick reclaim of 3.09 would weaken bearish continuation.
⚖️ Holding above 3.17 after sweeping the first short cluster would shift focus to 3.24–3.29, across relatively thin exposure at 3.19–3.23. Holding above 3.29 would bring 3.39–3.45 into view; farther out sits 3.59–3.68, with the map’s largest bar near 3.64.
#LiquidationMap