Everyone sees +17% and thinks $KDA is bouncing. They’re reading the headline, not the chart.
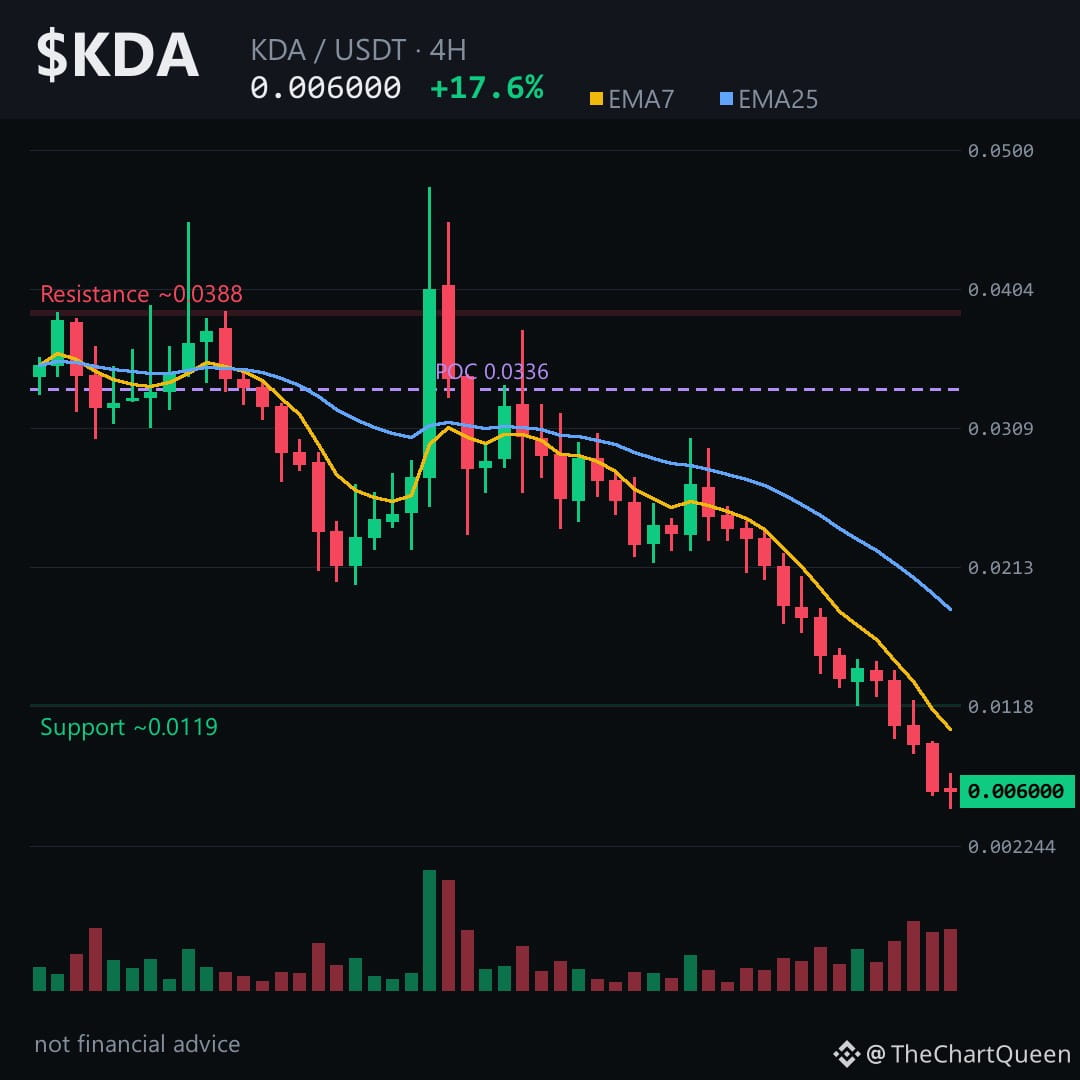
That green 4H candle is a corpse bounce inside an 11-of-12 red candle cascade. Price didn’t reclaim structure — it just paused at the bottom of a waterfall. And the daily picture is worse: price sits miles below both key averages, with momentum pinned near the floor. This is not accumulation. This is a falling knife taking a breath.
The 4H read is the cleanest: the pivot zone near 0.0060 is the only thing holding. Lose that on a 4H close and the next obvious destination is the unfilled gap below — the 0.0055 area, roughly where the last 35% collapse ran out of sellers. Invalidation sits just above, around 0.0063. If price can’t even reclaim that tiny ledge, the bounce is already over.
Tap $KDA to pull up the chart and see how thin this bounce really is.
My read: the +17% is noise inside a much larger downtrend. The risk isn’t missing the bottom — it’s mistaking a dead-cat twitch for a reversal.
If this zone fails, I’ll map the next support where liquidity actually sits. Follow so that read lands on your feed.
Which level are you trusting more on $KDA — the bounce zone or the gap below? 👇
⚠️ Not financial advice. DYOR.
#KDA #Kadena #Crypto #BinanceSquare
That green 4H candle is a corpse bounce inside an 11-of-12 red candle cascade. Price didn’t reclaim structure — it just paused at the bottom of a waterfall. And the daily picture is worse: price sits miles below both key averages, with momentum pinned near the floor. This is not accumulation. This is a falling knife taking a breath.
The 4H read is the cleanest: the pivot zone near 0.0060 is the only thing holding. Lose that on a 4H close and the next obvious destination is the unfilled gap below — the 0.0055 area, roughly where the last 35% collapse ran out of sellers. Invalidation sits just above, around 0.0063. If price can’t even reclaim that tiny ledge, the bounce is already over.
Tap $KDA to pull up the chart and see how thin this bounce really is.
My read: the +17% is noise inside a much larger downtrend. The risk isn’t missing the bottom — it’s mistaking a dead-cat twitch for a reversal.
If this zone fails, I’ll map the next support where liquidity actually sits. Follow so that read lands on your feed.
Which level are you trusting more on $KDA — the bounce zone or the gap below? 👇
⚠️ Not financial advice. DYOR.
#KDA #Kadena #Crypto #BinanceSquare