$BARD: Why Apparent Altcoin Unity May Mask Underlying Dispersion
$BARD: BARD shows an hourly up direction while its volume stays not above baseline. Does that single move imply a broader market shift, or could it be a localized artifact? The headline index often aggregates many assets, creating an illusion of uniform momentum. A peer example, BTC, also moves up hourly but without elevated volume, whereas SHELL moves down hourly with similarly muted volume. Both cases share directionality but differ in sign, suggesting that the aggregate index may hide divergent forces.
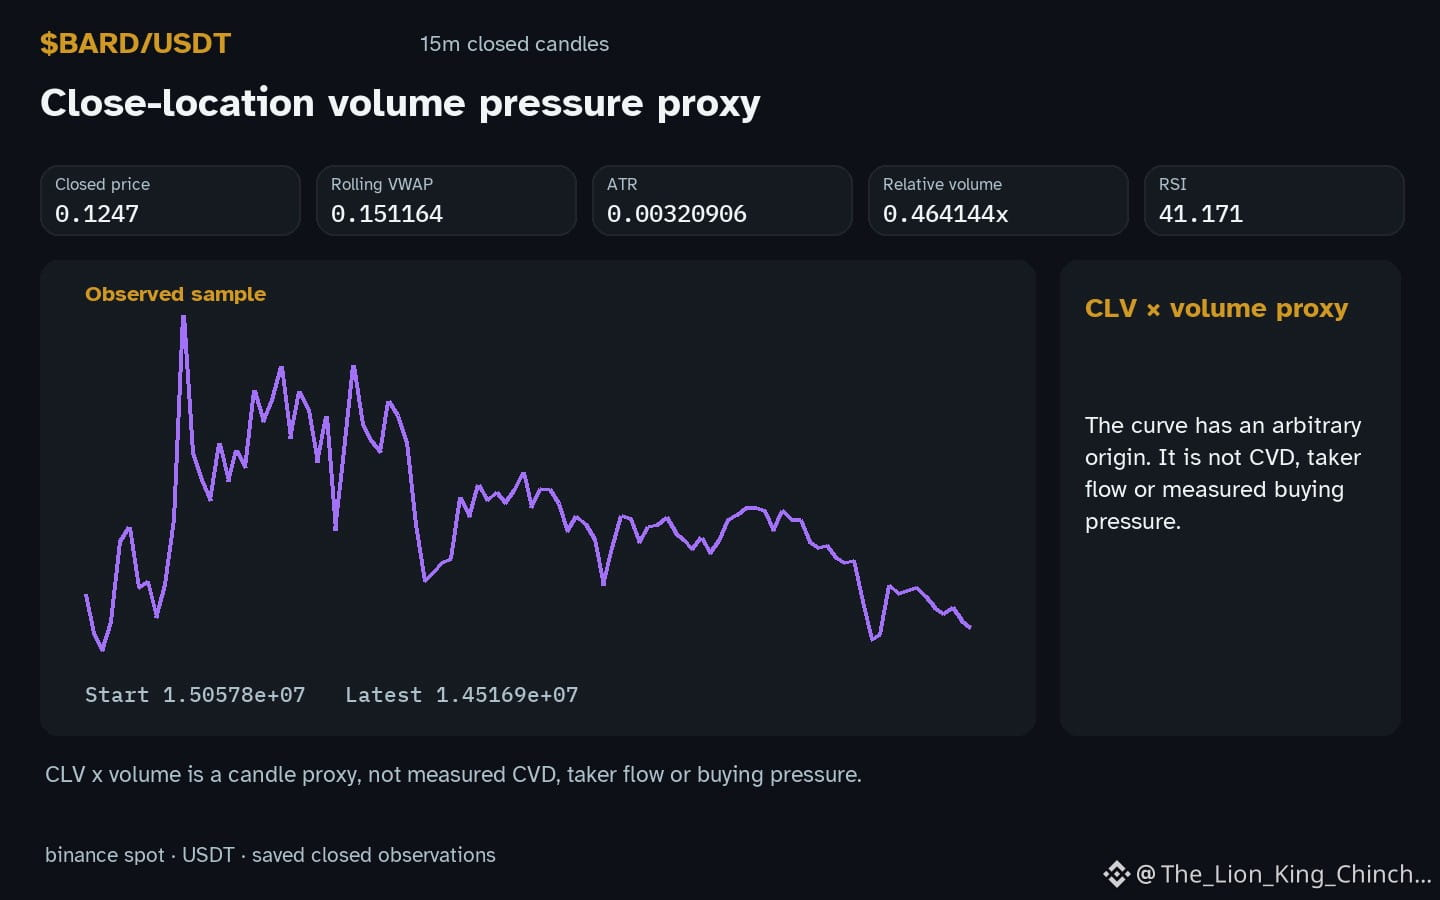
One possible mechanism is dispersion in trader exposure: participants allocate capital across assets based on distinct risk buffers, leading to similar directional bias but independent volume footprints. This hypothesis relies on the observation that BARD’s relative volume 0.46x baseline does not exceed its norm, and its RSI 41.2 remains within a neutral band. If dispersion drives the pattern, a future candle that shows a simultaneous spike in relative volume for all three assets would weaken the argument, indicating coordinated buying rather than isolated decisions. Conversely, continued muted volume despite directional consensus would reinforce the dispersion view. Monitoring the next closed hourly candle for divergent volume spikes will help reassess whether the apparent unity is genuine or merely a statistical overlay.
Probabilistic market research, not a recommendation or guaranteed return.
Watchlist contrast: $BTC has hourly direction up and volume not above its baseline; $SHELL has hourly direction down and volume not above its baseline. This alone does not establish correlation.
#BARD #BTC #SHELL #CryptoWatchlist
$BARD: BARD shows an hourly up direction while its volume stays not above baseline. Does that single move imply a broader market shift, or could it be a localized artifact? The headline index often aggregates many assets, creating an illusion of uniform momentum. A peer example, BTC, also moves up hourly but without elevated volume, whereas SHELL moves down hourly with similarly muted volume. Both cases share directionality but differ in sign, suggesting that the aggregate index may hide divergent forces.
One possible mechanism is dispersion in trader exposure: participants allocate capital across assets based on distinct risk buffers, leading to similar directional bias but independent volume footprints. This hypothesis relies on the observation that BARD’s relative volume 0.46x baseline does not exceed its norm, and its RSI 41.2 remains within a neutral band. If dispersion drives the pattern, a future candle that shows a simultaneous spike in relative volume for all three assets would weaken the argument, indicating coordinated buying rather than isolated decisions. Conversely, continued muted volume despite directional consensus would reinforce the dispersion view. Monitoring the next closed hourly candle for divergent volume spikes will help reassess whether the apparent unity is genuine or merely a statistical overlay.
Probabilistic market research, not a recommendation or guaranteed return.
Watchlist contrast: $BTC has hourly direction up and volume not above its baseline; $SHELL has hourly direction down and volume not above its baseline. This alone does not establish correlation.
#BARD #BTC #SHELL #CryptoWatchlist