$ERA : How Transparent Methodology Turns Readers Into Better Analysts
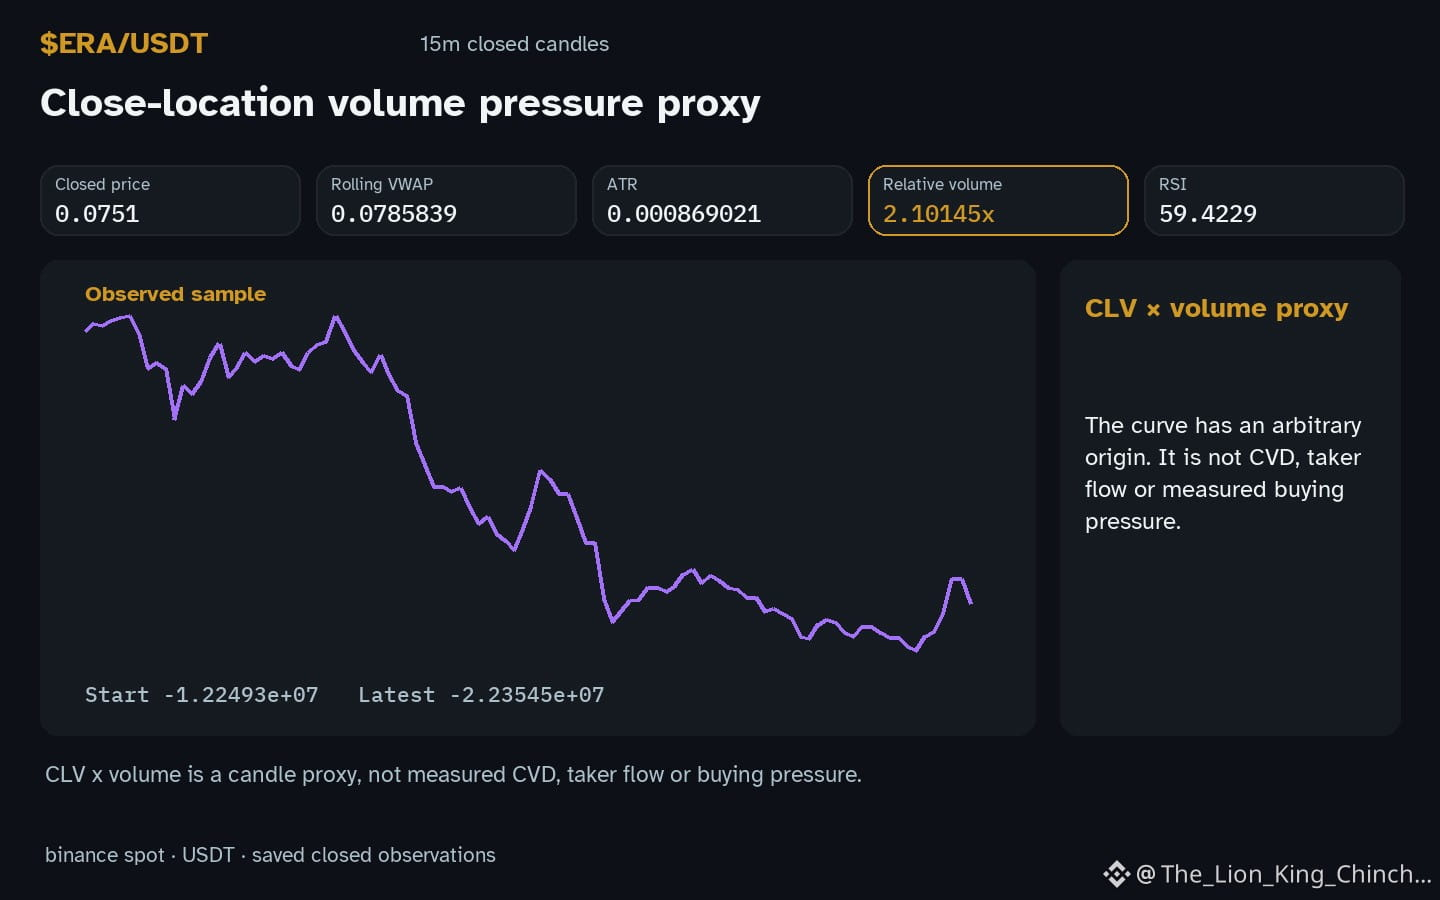
Why does $ERA appear to move upward while the volume indicator sits above baseline? The observation shows an hourly up direction inside the recorded range, which raises a question about how analysts justify that pattern. A common assumption is that higher volume confirms the price move, but the data only tells us that relative volume is 2.10x baseline and that RSI 59.4 sits at a neutral level. Without knowing the underlying order flow, the rise could simply reflect a short‑term swing within a range rather than a sustained trend.
The counterexample to consider is a scenario where the same volume level appears during a sideways market and does not lead to further price appreciation. In that case, the up direction would be a false signal if interpreted as a breakout. The key mechanism here is separating the observation (price moved up, volume above baseline) from the persuasive narrative that it predicts future gains. Readers can test this by tracking the next closed‑candle: if the price fails to break the local resistance 0.0756 and RSI drops, the initial reading loses weight.
A practical reassessment step is to wait for a confirming candle that either pushes price beyond 0.0756 with sustained volume or shows a reversal pattern. This disciplined approach helps avoid social proof bias and keeps analysis grounded in observable data. 🤔
Probabilistic market research, not a recommendation or guaranteed return.
#ERA #CryptoCommunity #CryptoLearning
Why does $ERA appear to move upward while the volume indicator sits above baseline? The observation shows an hourly up direction inside the recorded range, which raises a question about how analysts justify that pattern. A common assumption is that higher volume confirms the price move, but the data only tells us that relative volume is 2.10x baseline and that RSI 59.4 sits at a neutral level. Without knowing the underlying order flow, the rise could simply reflect a short‑term swing within a range rather than a sustained trend.
The counterexample to consider is a scenario where the same volume level appears during a sideways market and does not lead to further price appreciation. In that case, the up direction would be a false signal if interpreted as a breakout. The key mechanism here is separating the observation (price moved up, volume above baseline) from the persuasive narrative that it predicts future gains. Readers can test this by tracking the next closed‑candle: if the price fails to break the local resistance 0.0756 and RSI drops, the initial reading loses weight.
A practical reassessment step is to wait for a confirming candle that either pushes price beyond 0.0756 with sustained volume or shows a reversal pattern. This disciplined approach helps avoid social proof bias and keeps analysis grounded in observable data. 🤔
Probabilistic market research, not a recommendation or guaranteed return.
#ERA #CryptoCommunity #CryptoLearning