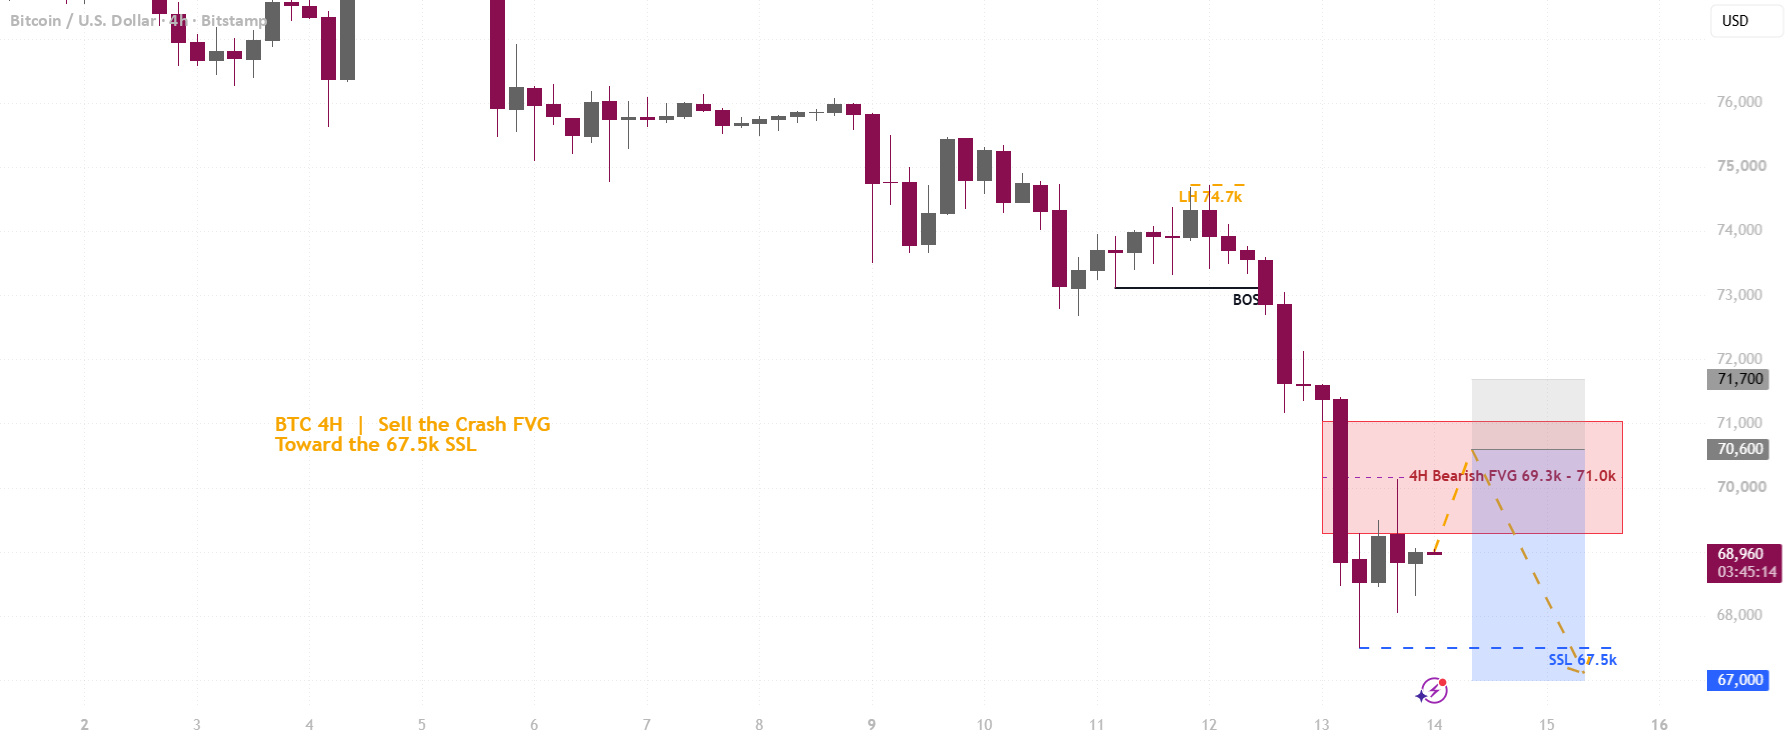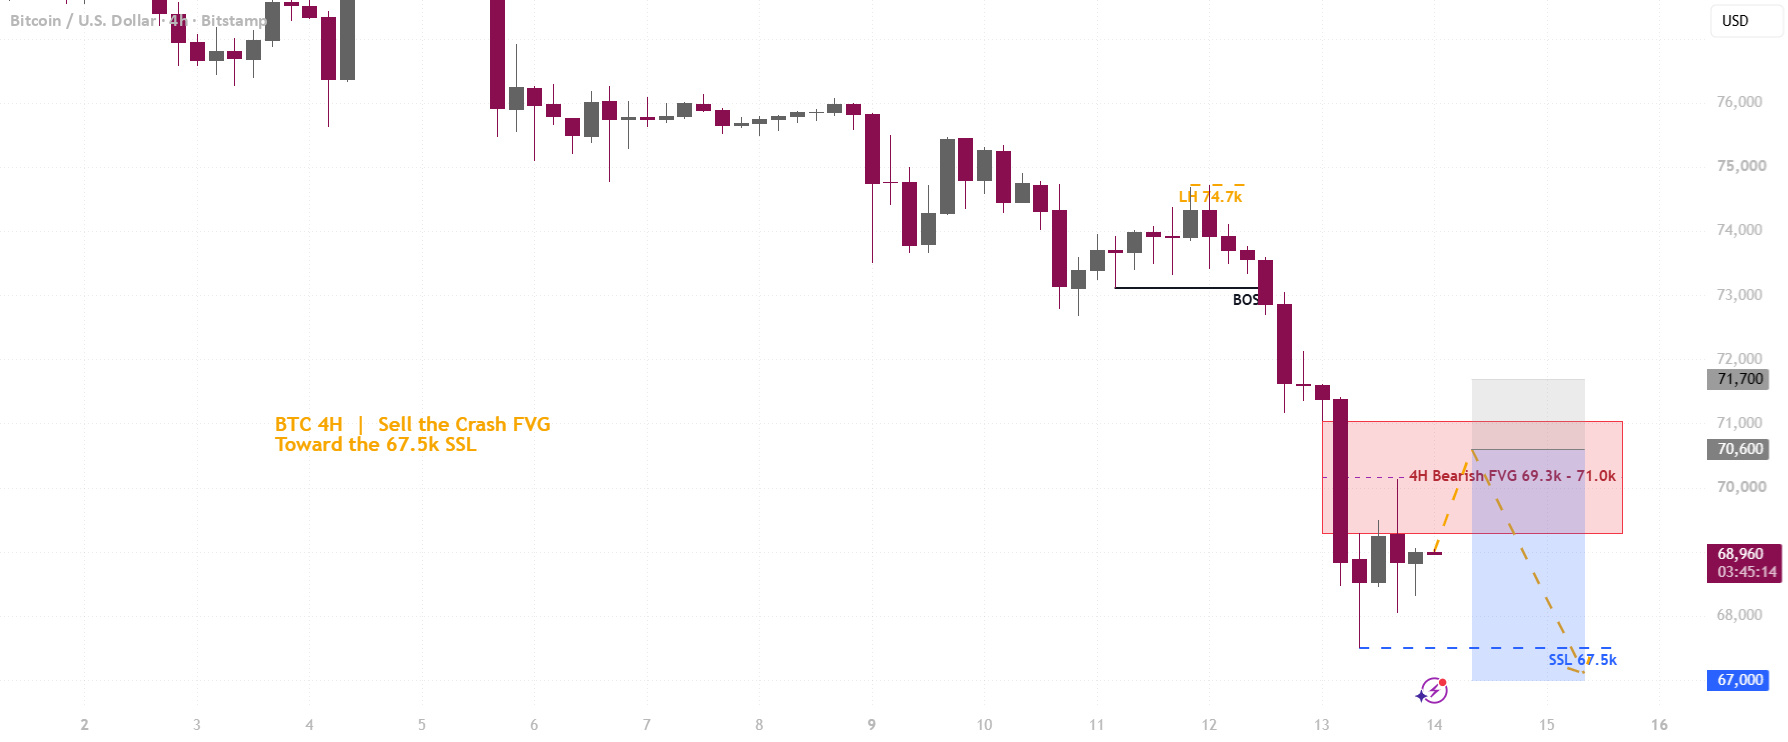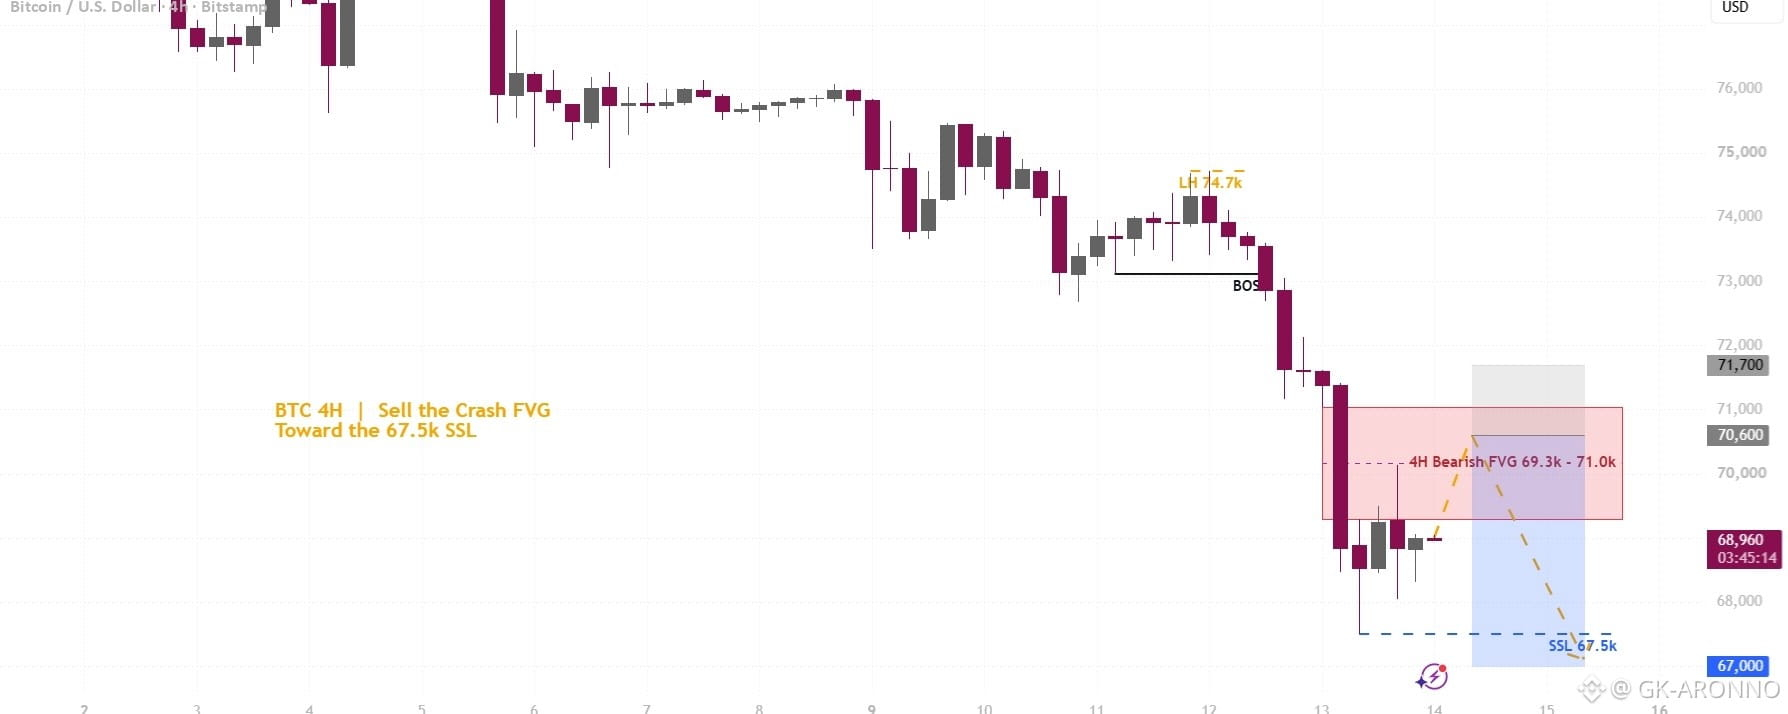


Bitcoin lost nearly 4,000 points in less than a day, and the 4H chart now shows a clean bearish sequence. Here's the map I'm using.
Structure
Lower highs keep stacking up, with the latest one at 74.7k on Nov 11. On Nov 12 price broke the 73.1k low (BOS), and early on Nov 13 a single 4H candle dropped from 71.4k to 68.5k. The low so far is 67.5k.
Supply (above price)
4H bearish FVG 69.3k - 71.0k: the imbalance left by that crash candle. Price already poked into the bottom of it at 70.1k and got rejected, but the middle of the gap hasn't been tested yet.
LH 74.7k: the last lower high. As long as it holds, the bigger trend stays down.
Liquidity (below price)
SSL ~67.5k: today's low, with another wick at 68.0k just above it. Those sell stops are the next target.
Scenario I'm watching
1. A relief bounce into the middle of the FVG around 70.6k.
2. Rejection and a lower timeframe shift back down.
3. Continuation through the 67.5k SSL.
Example plan on the chart: short 70,600, invalidation 71,700, target 67,000 (about 1:3.3 R:R).
Invalidation: a 4H close above 71,700 fills the FVG and I'd step aside. If BTC just keeps sliding without a bounce, I won't chase it.
Do you think we get the bounce into the FVG first, or does 67.5k break straight away?
Personal analysis for educational purposes only, not financial advice. Always manage your risk.