$BANANAS31
/USDT: Heavy Selling Pressure – Is a Recovery Coming?
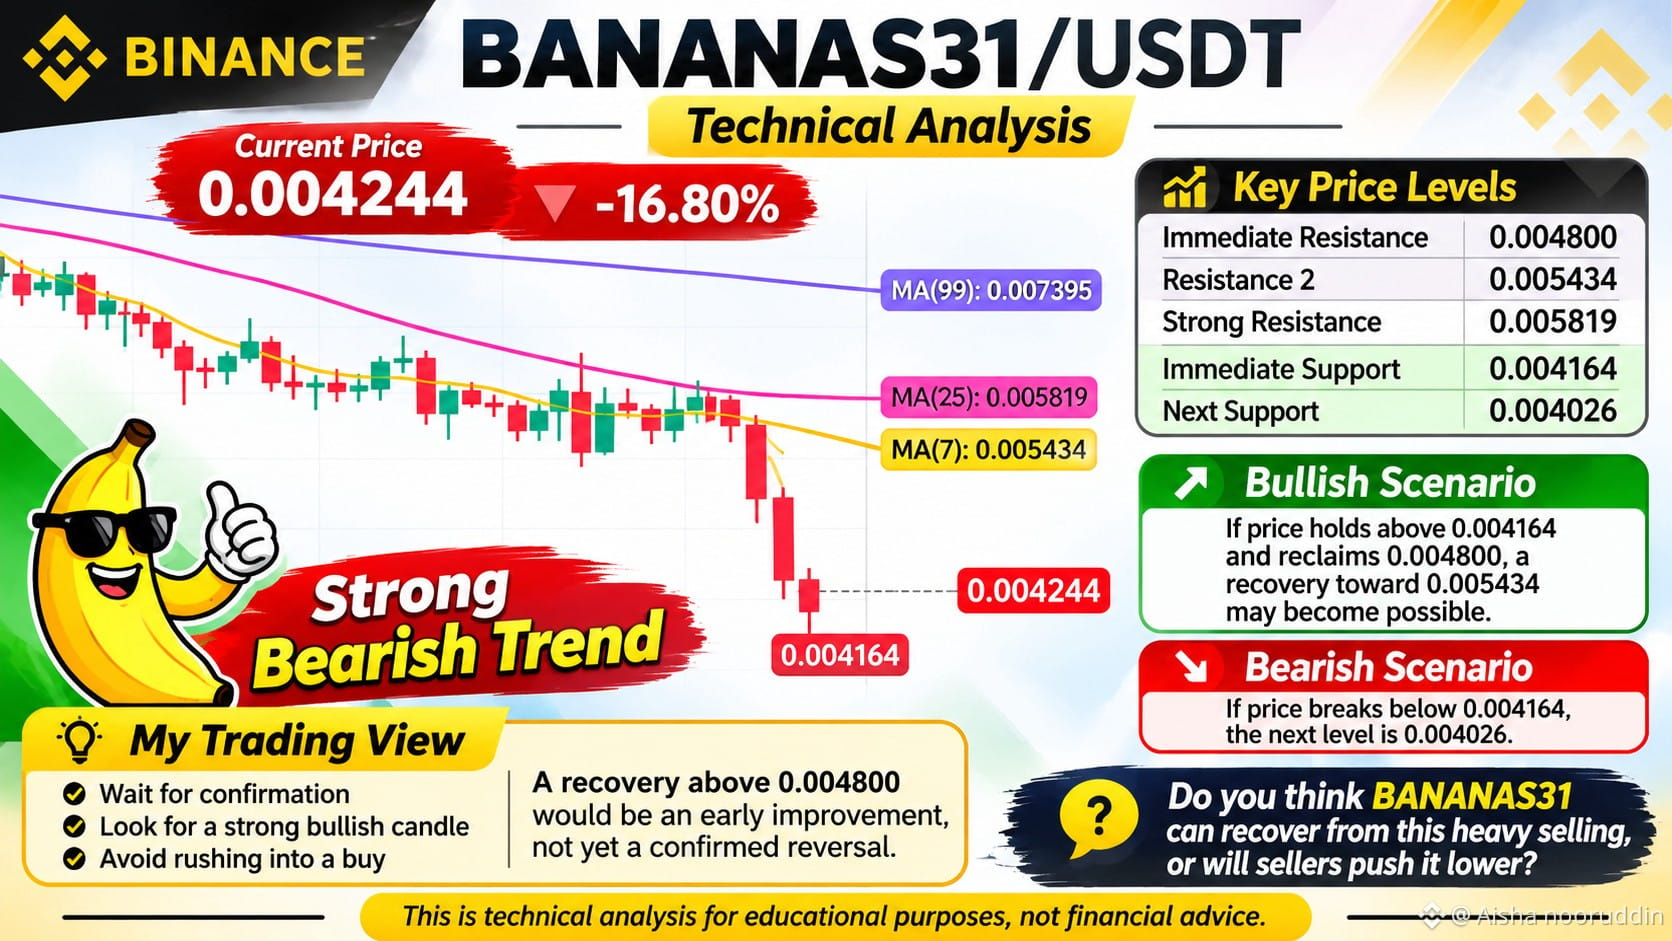
$BANANAS31 /USDT is facing significant selling pressure after dropping 16.80% in the latest 24-hour session. The price is currently trading around 0.004244 USDT, and the daily chart shows a clear bearish structure.
What Is Happening?
The price is trading below all three major moving averages:
* MA(7): 0.005434
* MA(25): 0.005819
* MA(99): 0.007395
This alignment indicates that sellers currently have control of the market.
Another important signal is the increase in trading volume during the recent red candles, suggesting strong selling activity.
# Key Support and Resistance Levels
Support zones:
* 0.004164
* 0.004026
Resistance zones:
* 0.004800
* 0.005434
* 0.005819
### 🔍 What Should Traders Watch?
Bullish possibility: If BANANAS31 holds above 0.004164 and buying volume increases, a recovery toward 0.004800 could become possible.
Bearish possibility: If the price breaks below 0.004164, further downside toward 0.004026 may follow.
A strong daily recovery candle and a move above resistance would provide better confirmation of a possible reversal.
### My Market View
At the moment, I prefer waiting rather than rushing into a buying position. The trend remains bearish, and entering without confirmation can be risky.
Patience and risk management are especially important during periods of heavy volatility.
### 💬 Let's Discuss
Do you think $BANANAS31 is preparing for a recovery, or could sellers push the price even lower?
Share your thoughts in the comments!
#BANANAS31 #CryptoAnalysis #TechnicalAnalysis #BinanceSquare #Altcoins
/USDT: Heavy Selling Pressure – Is a Recovery Coming?
$BANANAS31 /USDT is facing significant selling pressure after dropping 16.80% in the latest 24-hour session. The price is currently trading around 0.004244 USDT, and the daily chart shows a clear bearish structure.
What Is Happening?
The price is trading below all three major moving averages:
* MA(7): 0.005434
* MA(25): 0.005819
* MA(99): 0.007395
This alignment indicates that sellers currently have control of the market.
Another important signal is the increase in trading volume during the recent red candles, suggesting strong selling activity.
# Key Support and Resistance Levels
Support zones:
* 0.004164
* 0.004026
Resistance zones:
* 0.004800
* 0.005434
* 0.005819
### 🔍 What Should Traders Watch?
Bullish possibility: If BANANAS31 holds above 0.004164 and buying volume increases, a recovery toward 0.004800 could become possible.
Bearish possibility: If the price breaks below 0.004164, further downside toward 0.004026 may follow.
A strong daily recovery candle and a move above resistance would provide better confirmation of a possible reversal.
### My Market View
At the moment, I prefer waiting rather than rushing into a buying position. The trend remains bearish, and entering without confirmation can be risky.
Patience and risk management are especially important during periods of heavy volatility.
### 💬 Let's Discuss
Do you think $BANANAS31 is preparing for a recovery, or could sellers push the price even lower?
Share your thoughts in the comments!
#BANANAS31 #CryptoAnalysis #TechnicalAnalysis #BinanceSquare #Altcoins