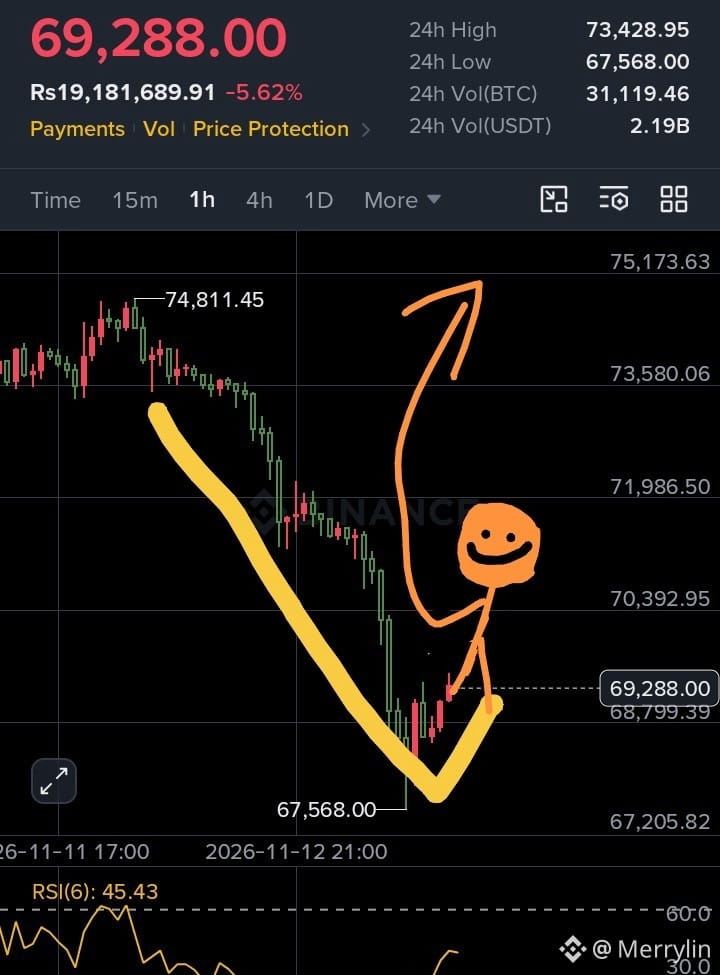
👁️📖 BTC Story - 1 Hour Chart 📊🫣
Everyone is talking about another Bitcoin crash right now, and honestly, the past few days have tested every trader's patience. After dropping to a 24h low of $67,568,$BTC is currently trying to stabilize around $69,288 on the 1-hour chart.
Here is what the chart is actually telling us:
The 1H RSI has bounced back to 45.43 from oversold territory, meaning selling pressure is starting to slow down. Right now, most retail traders are heavily positioned for a further drop. When the crowd leans too far on one side, the market loves to surprise them.💛
If buyers can push BTC back above the $70,400 – $72,000 resistance zone, late short sellers could get trapped, triggering a fast relief bounce. On the flip side, losing the $67,500 support opens the door for deeper pain.🔥
Sometimes the smartest trade in a fearful market is waiting for confirmation instead of guessing the bottom. Are you expecting a short squeeze from here or another leg down? Share your chart view below! 👇
#BTC #crypto #trading #Write2Earn #MerrylinTrade
$BTC
Everyone is talking about another Bitcoin crash right now, and honestly, the past few days have tested every trader's patience. After dropping to a 24h low of $67,568,$BTC is currently trying to stabilize around $69,288 on the 1-hour chart.
Here is what the chart is actually telling us:
The 1H RSI has bounced back to 45.43 from oversold territory, meaning selling pressure is starting to slow down. Right now, most retail traders are heavily positioned for a further drop. When the crowd leans too far on one side, the market loves to surprise them.💛
If buyers can push BTC back above the $70,400 – $72,000 resistance zone, late short sellers could get trapped, triggering a fast relief bounce. On the flip side, losing the $67,500 support opens the door for deeper pain.🔥
Sometimes the smartest trade in a fearful market is waiting for confirmation instead of guessing the bottom. Are you expecting a short squeeze from here or another leg down? Share your chart view below! 👇
#BTC #crypto #trading #Write2Earn #MerrylinTrade
$BTC