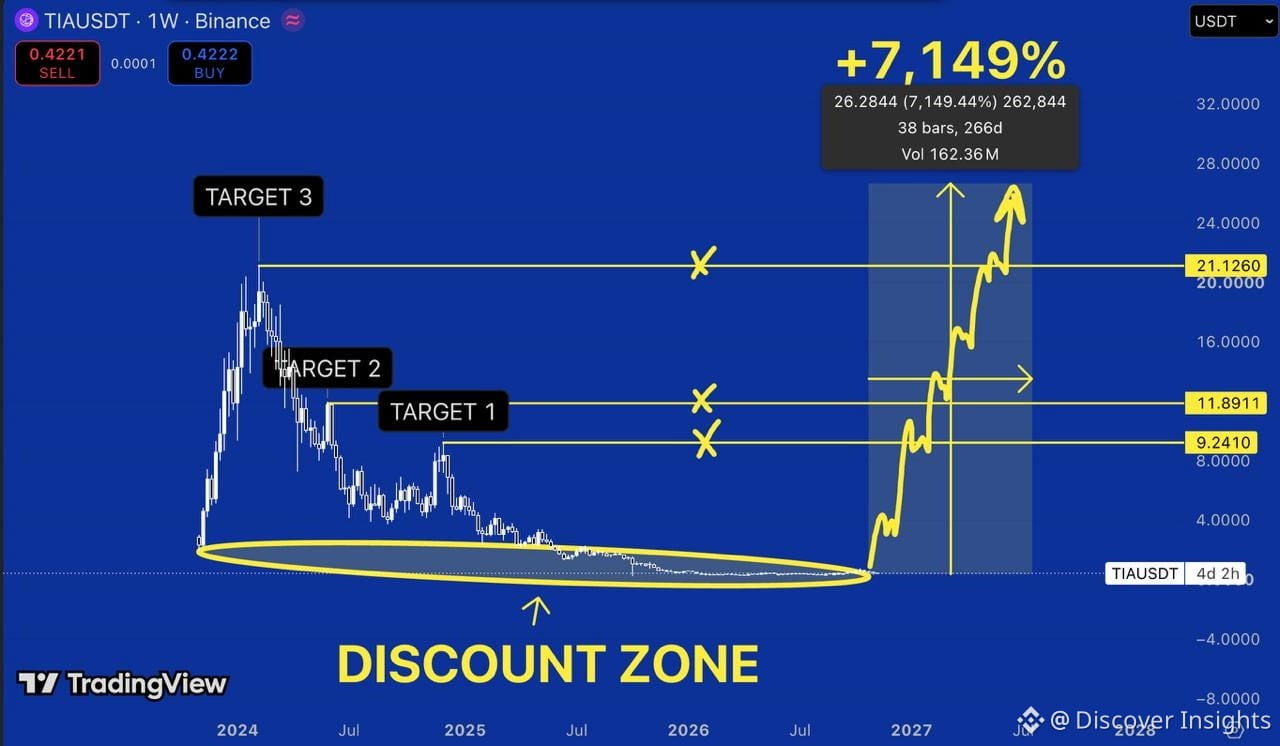
$TIA is trading around $0.42.
And this weekly chart is showing one of the most extreme discount zones in the altcoin market.
Remember when TIA was trading above $21?
Since then, it's been a relentless decline.
Lower highs. Failed recoveries. Almost two years of selling pressure.
Now price is sitting near its historical lows.
But here's what caught my attention.
After such an extended downtrend, TIA is beginning to consolidate inside a major long-term support region.
Volatility has compressed, and the market is approaching another important decision point.
Could this be the beginning of a new accumulation phase?
Possibly. But buyers still need to prove it.
Here's my roadmap.
$1–2 — First important resistance region.
$4–5 — Next major supply zone.
$9.24 — First major target.
$11.89 — Second target.
$21.12 — Previous major high.
And $26.70? That's my extreme bull scenario.
The chart illustrates a potential 7,149% move from its marked historical base.
But a projected 70x isn't a confirmed opportunity.
For that scenario to become realistic, TIA would need sustained buying pressure, a major shift in market structure, and enough demand to absorb future token supply.
That's especially important for an asset with ongoing token unlocks and potential dilution.
First, I want to see TIA reclaim $1 and start establishing higher lows on the weekly timeframe.
Until then, this remains a highly speculative reversal setup.
What makes the chart interesting is the psychology.
Traders were chasing TIA above $15.
Now it's near $0.42, and the enthusiasm has almost completely disappeared.
That doesn't automatically make it cheap.
But if buyers finally break the sequence of lower highs, the market could start telling a very different story.
#WhatWillDriveCryptoandStocks’NextRebound?
$TIA
And this weekly chart is showing one of the most extreme discount zones in the altcoin market.
Remember when TIA was trading above $21?
Since then, it's been a relentless decline.
Lower highs. Failed recoveries. Almost two years of selling pressure.
Now price is sitting near its historical lows.
But here's what caught my attention.
After such an extended downtrend, TIA is beginning to consolidate inside a major long-term support region.
Volatility has compressed, and the market is approaching another important decision point.
Could this be the beginning of a new accumulation phase?
Possibly. But buyers still need to prove it.
Here's my roadmap.
$1–2 — First important resistance region.
$4–5 — Next major supply zone.
$9.24 — First major target.
$11.89 — Second target.
$21.12 — Previous major high.
And $26.70? That's my extreme bull scenario.
The chart illustrates a potential 7,149% move from its marked historical base.
But a projected 70x isn't a confirmed opportunity.
For that scenario to become realistic, TIA would need sustained buying pressure, a major shift in market structure, and enough demand to absorb future token supply.
That's especially important for an asset with ongoing token unlocks and potential dilution.
First, I want to see TIA reclaim $1 and start establishing higher lows on the weekly timeframe.
Until then, this remains a highly speculative reversal setup.
What makes the chart interesting is the psychology.
Traders were chasing TIA above $15.
Now it's near $0.42, and the enthusiasm has almost completely disappeared.
That doesn't automatically make it cheap.
But if buyers finally break the sequence of lower highs, the market could start telling a very different story.
#WhatWillDriveCryptoandStocks’NextRebound?
$TIA