BNB COIN – PROFESSIONAL MARKET ANALYSIS
Date: 13 November 2026
Hello everyone, welcome back to our professional crypto market analysis.
Today, we are analyzing Binance Coin, also known as BNB.
Let's start with the current market situation.
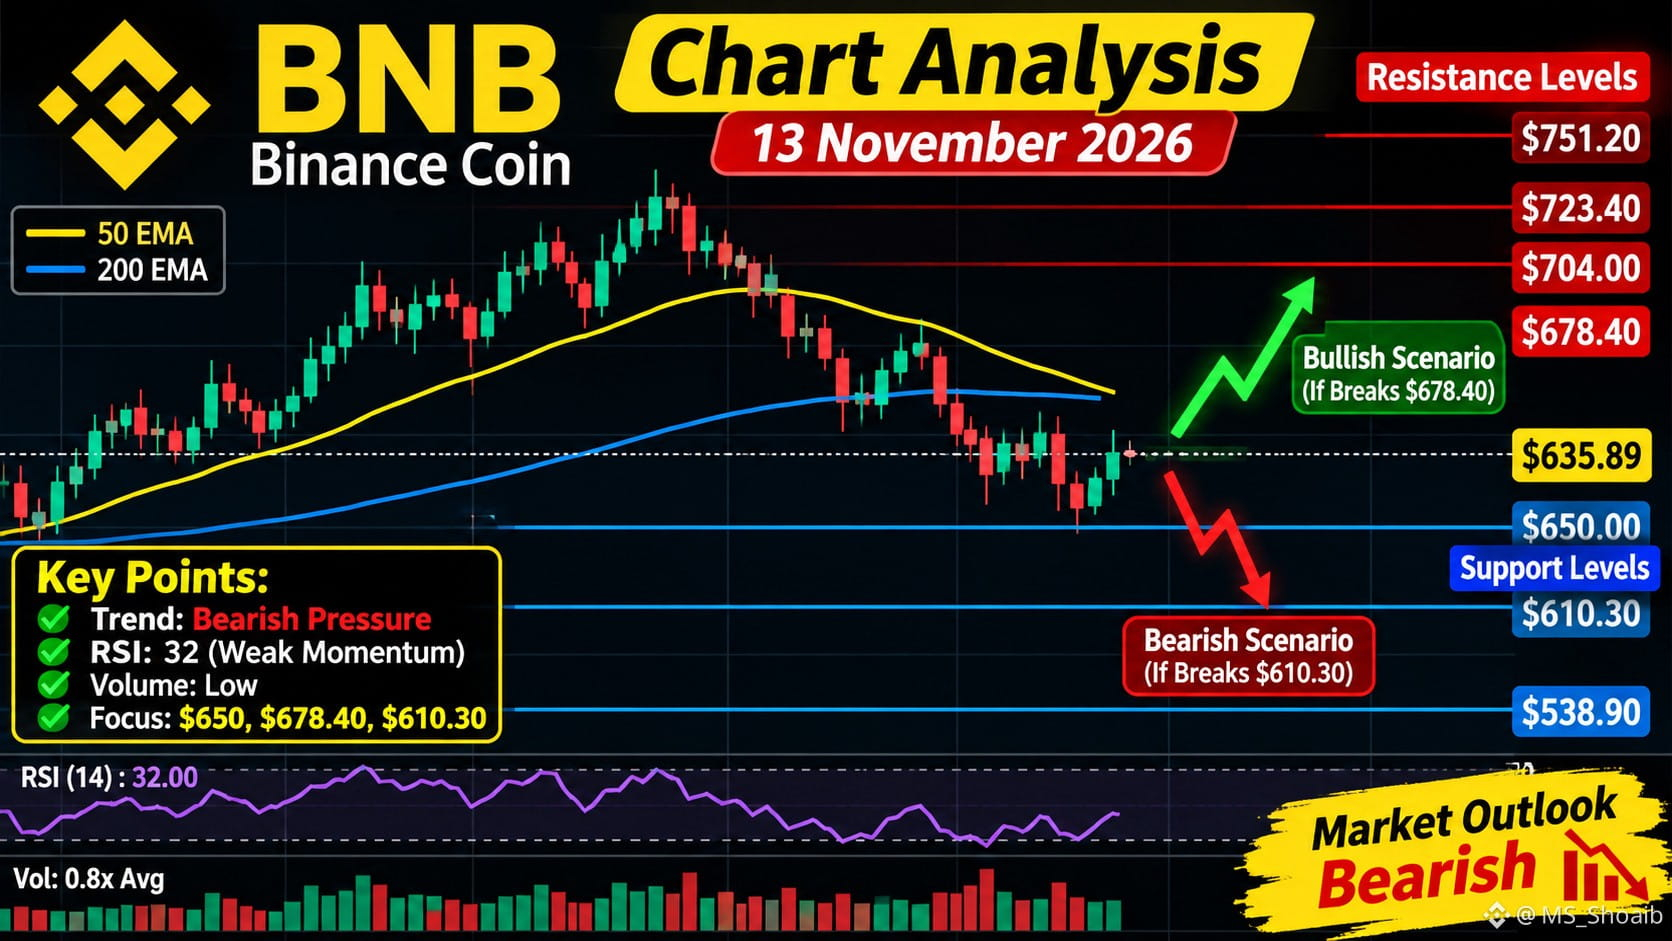
BNB is currently trading around $635.89, showing approximately a 5.70% decline over the last 24 hours.
The market is experiencing selling pressure, and traders are watching important support and resistance levels.
1. Market Structure
Looking at the overall market structure, BNB is showing short-term bearish pressure.
The price is trading below its 50 EMA, which is currently around $716.
The RSI indicator is near 32, showing relatively weak market momentum.
This means buyers have not yet demonstrated a strong recovery.
2. Support Levels
Now let's discuss the important support zones.
The first important level is $650.
The next support level is around $610.30.
If selling pressure continues, another major historical support zone is near $538.90.
These levels are important for understanding possible market reactions.
3. Resistance Levels
On the upside, the first resistance is around $678.40.
The second resistance is $704.
The next important resistance is $723.40.
A stronger recovery would require buyers to regain control and maintain price strength above these areas.
4. Bullish Scenario
Let's discuss the bullish scenario.
If BNB recovers above $650 and establishes strength above $678.40, market sentiment could improve.
The next resistance areas to watch would be $704 and $723.40.
However, confirmation is important. A temporary price increase does not automatically mean a bullish trend reversal.
5. Bearish Scenario
Now let's discuss the bearish scenario.
If selling pressure increases and BNB loses its current intraday support around $622, the next important area to monitor is $610.30.
If that level also fails to hold, the market could experience further weakness.
6. Risk Management
#BNB金鏟子
#BTC☀ $BNB
Date: 13 November 2026
Hello everyone, welcome back to our professional crypto market analysis.
Today, we are analyzing Binance Coin, also known as BNB.
Let's start with the current market situation.
BNB is currently trading around $635.89, showing approximately a 5.70% decline over the last 24 hours.
The market is experiencing selling pressure, and traders are watching important support and resistance levels.
1. Market Structure
Looking at the overall market structure, BNB is showing short-term bearish pressure.
The price is trading below its 50 EMA, which is currently around $716.
The RSI indicator is near 32, showing relatively weak market momentum.
This means buyers have not yet demonstrated a strong recovery.
2. Support Levels
Now let's discuss the important support zones.
The first important level is $650.
The next support level is around $610.30.
If selling pressure continues, another major historical support zone is near $538.90.
These levels are important for understanding possible market reactions.
3. Resistance Levels
On the upside, the first resistance is around $678.40.
The second resistance is $704.
The next important resistance is $723.40.
A stronger recovery would require buyers to regain control and maintain price strength above these areas.
4. Bullish Scenario
Let's discuss the bullish scenario.
If BNB recovers above $650 and establishes strength above $678.40, market sentiment could improve.
The next resistance areas to watch would be $704 and $723.40.
However, confirmation is important. A temporary price increase does not automatically mean a bullish trend reversal.
5. Bearish Scenario
Now let's discuss the bearish scenario.
If selling pressure increases and BNB loses its current intraday support around $622, the next important area to monitor is $610.30.
If that level also fails to hold, the market could experience further weakness.
6. Risk Management
#BNB金鏟子
#BTC☀ $BNB