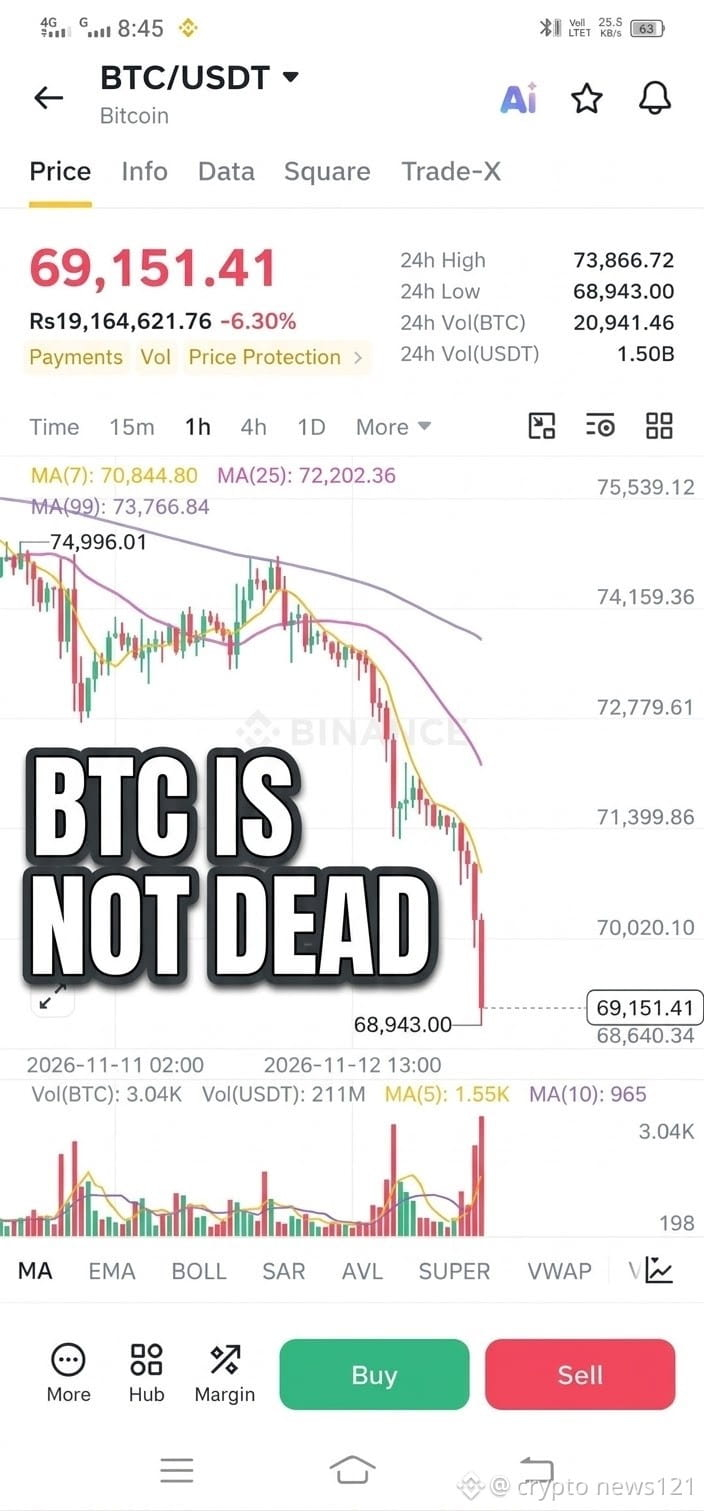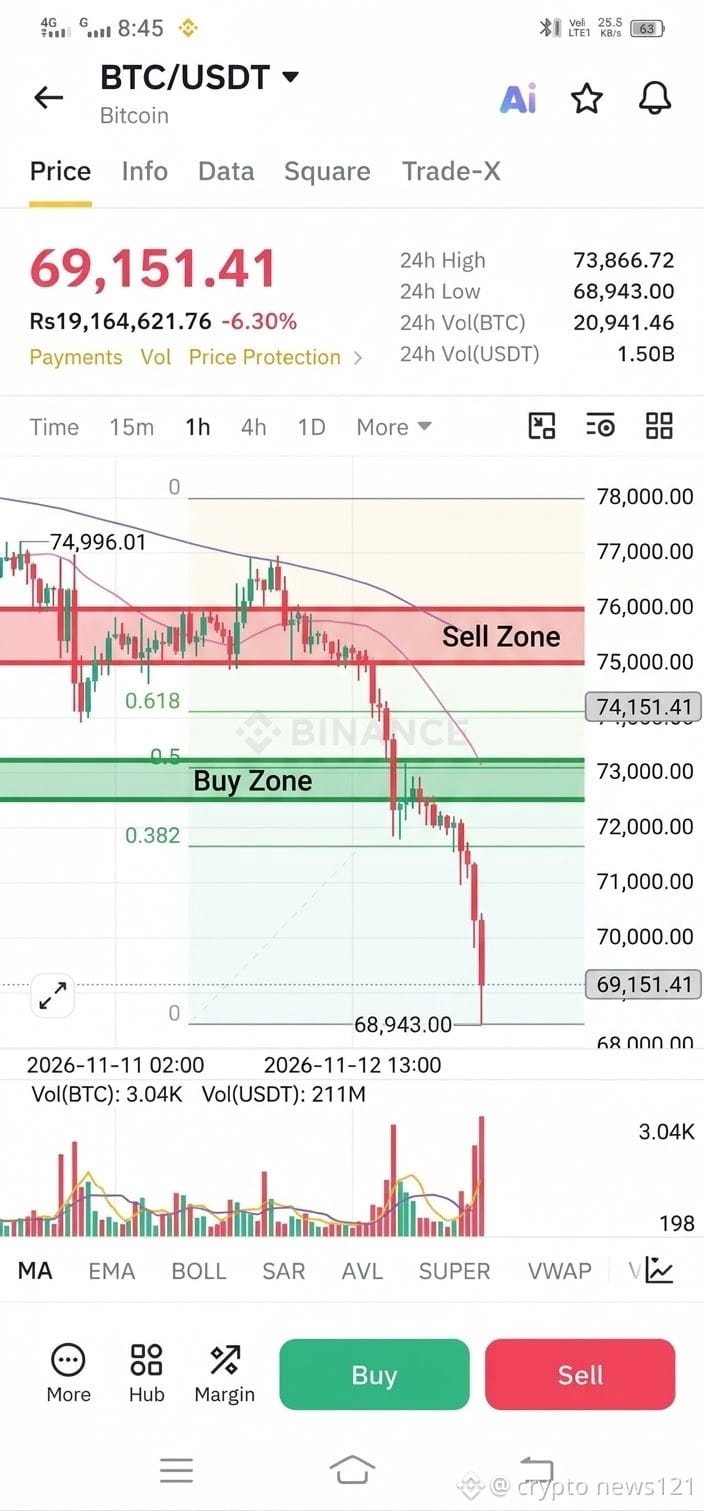
The 200-Day MA is the battleground: $BTC is hanging out around $73,200, basically glued to its 200-day moving average. It’s held as strong support for weeks, but it’s getting tested over and over.
ETF outflows are dragging us down: U.S. spot Bitcoin ETFs have pulled in over $1.4 billion in net outflows over recent sessions, with BlackRock’s IBIT alone shedding hundreds of millions. Institutional demand has definitely cooled off.
But whales aren't budging: While ETFs are bleeding, large wallets keep stacking, and Binance long/short ratios still show over 73% of accounts leaning long. Retail and whale bids haven't given up yet.
The real angle here: Most traders are obsessing over the $75,000 resistance. The smarter move is watching whether $73,000 holds on the daily close. If it breaks, the next liquidity pocket sits right around $70,000 to $72,500. If it holds, a short squeeze pushing toward the $76,000 upper Bollinger Band becomes the path of least resistance.
This isn’t a crystal-ball prediction; it’s a probability map. The market is coiled up tight, and the 200-day MA is the trigger.
Are you buying the dip at the 200-day MA, or waiting for us to reclaim $75K first?
Drop a 🚀 if you're accumulating, or a 🛡️ if you're sitting in cash. 👇
$BTC
$ETH
#bitcoin #ETH #CryptoMarket #AnthropicRejectsIPODelayValuationinQuestion #etf
ETF outflows are dragging us down: U.S. spot Bitcoin ETFs have pulled in over $1.4 billion in net outflows over recent sessions, with BlackRock’s IBIT alone shedding hundreds of millions. Institutional demand has definitely cooled off.
But whales aren't budging: While ETFs are bleeding, large wallets keep stacking, and Binance long/short ratios still show over 73% of accounts leaning long. Retail and whale bids haven't given up yet.
The real angle here: Most traders are obsessing over the $75,000 resistance. The smarter move is watching whether $73,000 holds on the daily close. If it breaks, the next liquidity pocket sits right around $70,000 to $72,500. If it holds, a short squeeze pushing toward the $76,000 upper Bollinger Band becomes the path of least resistance.
This isn’t a crystal-ball prediction; it’s a probability map. The market is coiled up tight, and the 200-day MA is the trigger.
Are you buying the dip at the 200-day MA, or waiting for us to reclaim $75K first?
Drop a 🚀 if you're accumulating, or a 🛡️ if you're sitting in cash. 👇
$BTC
$ETH
#bitcoin #ETH #CryptoMarket #AnthropicRejectsIPODelayValuationinQuestion #etf