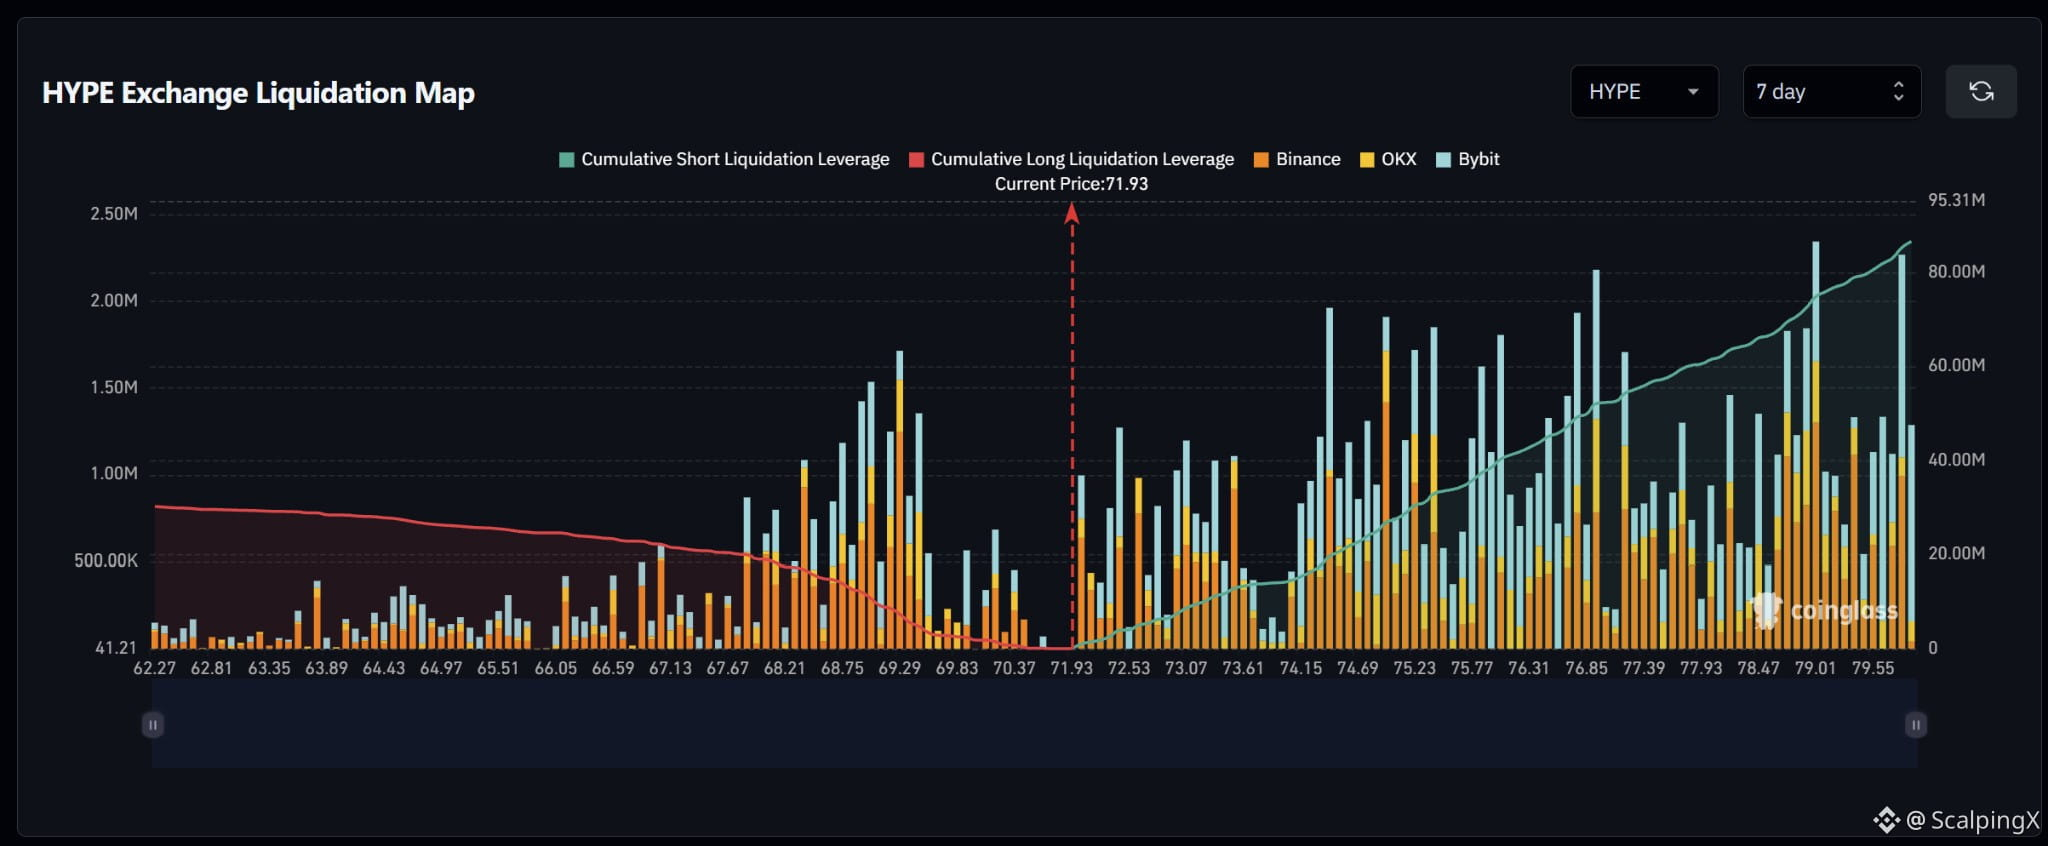
$HYPE – Liquidation Map (7 days) – Index ~71.93
🧭 The preferred scenario is a short-liquidation sweep at 72.0–72.6, where several potential liquidation bars sit close to price. Estimated cumulative short exposure substantially exceeds the long side, with further large clusters above.
🔺 A break and hold above 72.6 would shift focus to 73.0–73.6. Sweeping the first cluster before quickly dropping below 71.93 would weaken bullish continuation.
🎯 Holding above 73.6 would bring 74.2–75.5 into focus, following relatively thin exposure at 73.8–74.1. Farther out sits 76.0–77.3, particularly around 77.0; clusters at 78.7–79.8 become relevant if upward momentum persists through the earlier zones.
⚖️ Failure to hold 71.93 would shift focus to smaller long clusters at 70.3–70.9. Holding below 70.3 would bring the denser 68.7–69.5 band into view, particularly around 69.3. A downside sweep followed by a reclaim of 71.93 would weaken the bearish scenario.
#LiquidationMap
🧭 The preferred scenario is a short-liquidation sweep at 72.0–72.6, where several potential liquidation bars sit close to price. Estimated cumulative short exposure substantially exceeds the long side, with further large clusters above.
🔺 A break and hold above 72.6 would shift focus to 73.0–73.6. Sweeping the first cluster before quickly dropping below 71.93 would weaken bullish continuation.
🎯 Holding above 73.6 would bring 74.2–75.5 into focus, following relatively thin exposure at 73.8–74.1. Farther out sits 76.0–77.3, particularly around 77.0; clusters at 78.7–79.8 become relevant if upward momentum persists through the earlier zones.
⚖️ Failure to hold 71.93 would shift focus to smaller long clusters at 70.3–70.9. Holding below 70.3 would bring the denser 68.7–69.5 band into view, particularly around 69.3. A downside sweep followed by a reclaim of 71.93 would weaken the bearish scenario.
#LiquidationMap