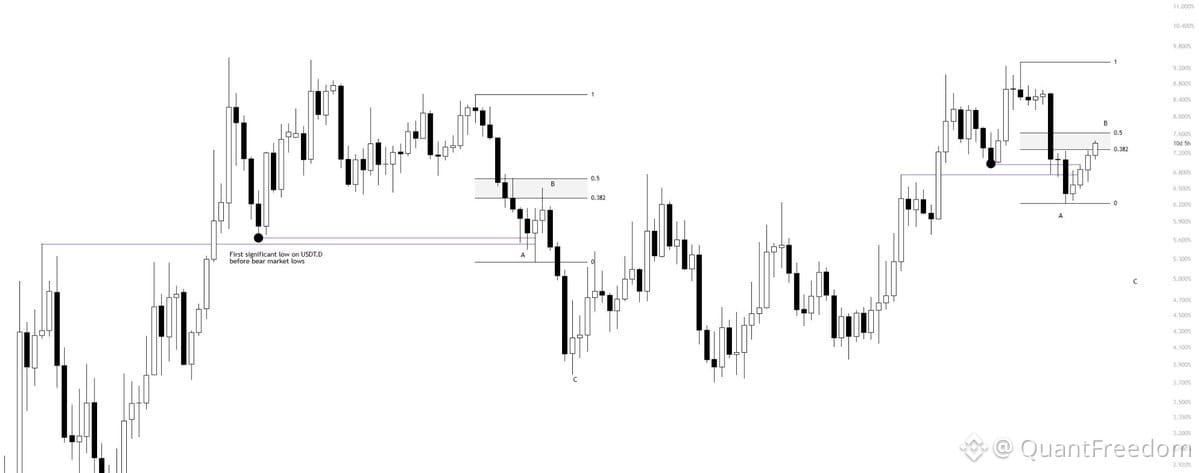
Watching a potential ABC correction on USDT.D that lines up with $BTC price action.
This was the original read. Wave B pushed slightly higher than anticipated, but the structure still holds.
Currently testing the 0.382–0.5 retracement zone — same area we tested before. Back in 2023, price deviated below the major low (black dot), reclaimed it briefly, then broke down again to form a Wave B high before the final leg lower.
Invalidation and trigger are clean:
If USDT.D rejects this zone and starts losing the black dotted low, that signals a similar pattern unfolding.
Right now, bears control the structure. Bulls need USDT.D to lose that black dotted low before considering a higher timeframe move up.
If we can't reclaim below the black dot, bulls are at risk short term.
This is the kind of chart that pays to watch — clean levels, clear invalidation, and a setup that fits the bigger picture. No edge until the structure confirms.
This was the original read. Wave B pushed slightly higher than anticipated, but the structure still holds.
Currently testing the 0.382–0.5 retracement zone — same area we tested before. Back in 2023, price deviated below the major low (black dot), reclaimed it briefly, then broke down again to form a Wave B high before the final leg lower.
Invalidation and trigger are clean:
If USDT.D rejects this zone and starts losing the black dotted low, that signals a similar pattern unfolding.
Right now, bears control the structure. Bulls need USDT.D to lose that black dotted low before considering a higher timeframe move up.
If we can't reclaim below the black dot, bulls are at risk short term.
This is the kind of chart that pays to watch — clean levels, clear invalidation, and a setup that fits the bigger picture. No edge until the structure confirms.