$BTC Bottom or Bear Trap? Critical levels tested right now! 🚀
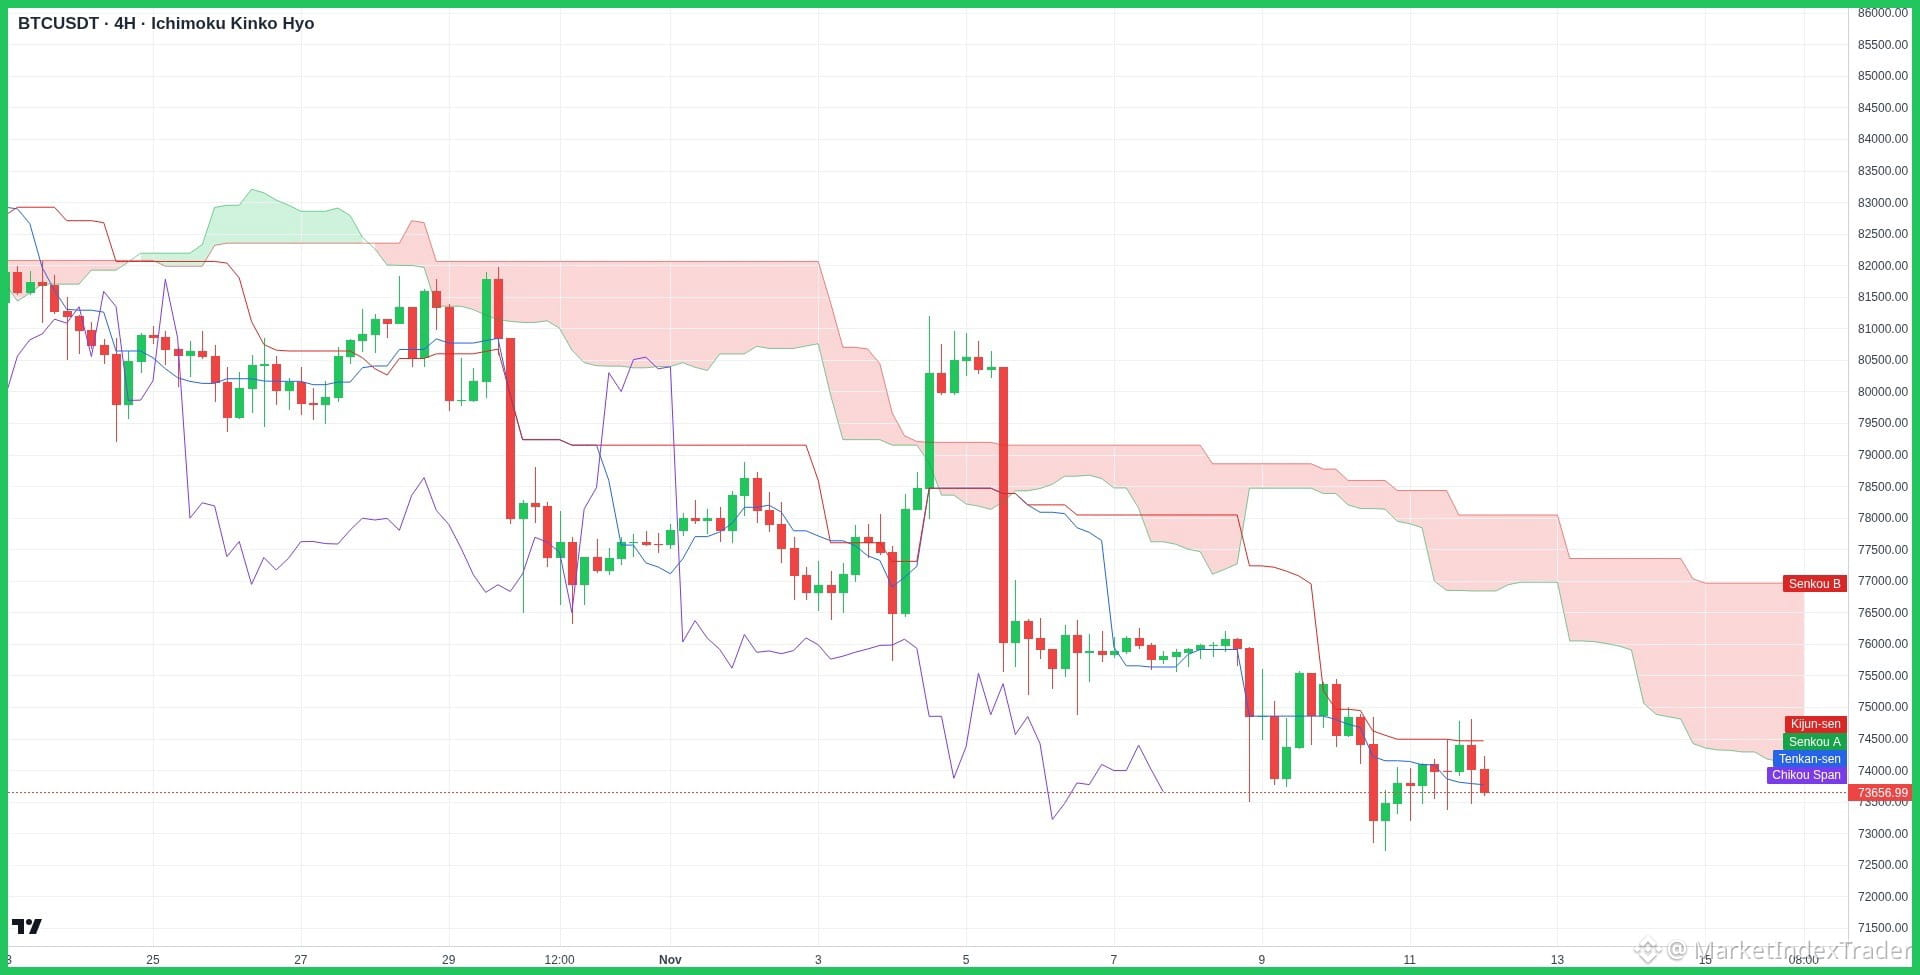
$BTC's 4H Ichimoku chart highlights consolidation around $73,600 as price attempts to break initial resistance near $74,800.
Alright team, let's break down this juicy $BTC chart and see what's cooking!
Looking at the 4-hour timeframe using Ichimoku Kinko Hyo, Bitcoin is currently consolidating around the $73,650 mark after finding strong buyer response near the $72,500 - $73,000 support zone. On the upside, immediate resistance sits right around the Tenkan-sen and Kijun-sen levels at $74,500 - $74,800, with major overhead cloud resistance spanning from $75,500 to $77,000.
On the fundamental side, Bitcoin continues to display powerful macro resilience driven by steady institutional spot ETF inflows and expanding corporate treasury adoption. Additionally, long-term holder accumulation metrics remain exceptionally strong, proving that high-conviction investors are absorbing recent dips.
My game plan? I'm looking for a solid 4H candle closure above $74,800 to spark momentum toward testing the $77,000 cloud upper boundary. Dips into the $73,000 support offer great dollar-cost averaging opportunities.
Highly recommend HOLD and Stacking $BTC at Binance
Feel free to comment the altcoin you are holding and we will check it for you!
BTC #TechnicalAnalysis #Crypto #BinanceSquare #Bitcoin
$BTC's 4H Ichimoku chart highlights consolidation around $73,600 as price attempts to break initial resistance near $74,800.
Alright team, let's break down this juicy $BTC chart and see what's cooking!
Looking at the 4-hour timeframe using Ichimoku Kinko Hyo, Bitcoin is currently consolidating around the $73,650 mark after finding strong buyer response near the $72,500 - $73,000 support zone. On the upside, immediate resistance sits right around the Tenkan-sen and Kijun-sen levels at $74,500 - $74,800, with major overhead cloud resistance spanning from $75,500 to $77,000.
On the fundamental side, Bitcoin continues to display powerful macro resilience driven by steady institutional spot ETF inflows and expanding corporate treasury adoption. Additionally, long-term holder accumulation metrics remain exceptionally strong, proving that high-conviction investors are absorbing recent dips.
My game plan? I'm looking for a solid 4H candle closure above $74,800 to spark momentum toward testing the $77,000 cloud upper boundary. Dips into the $73,000 support offer great dollar-cost averaging opportunities.
Highly recommend HOLD and Stacking $BTC at Binance
Feel free to comment the altcoin you are holding and we will check it for you!
BTC #TechnicalAnalysis #Crypto #BinanceSquare #Bitcoin