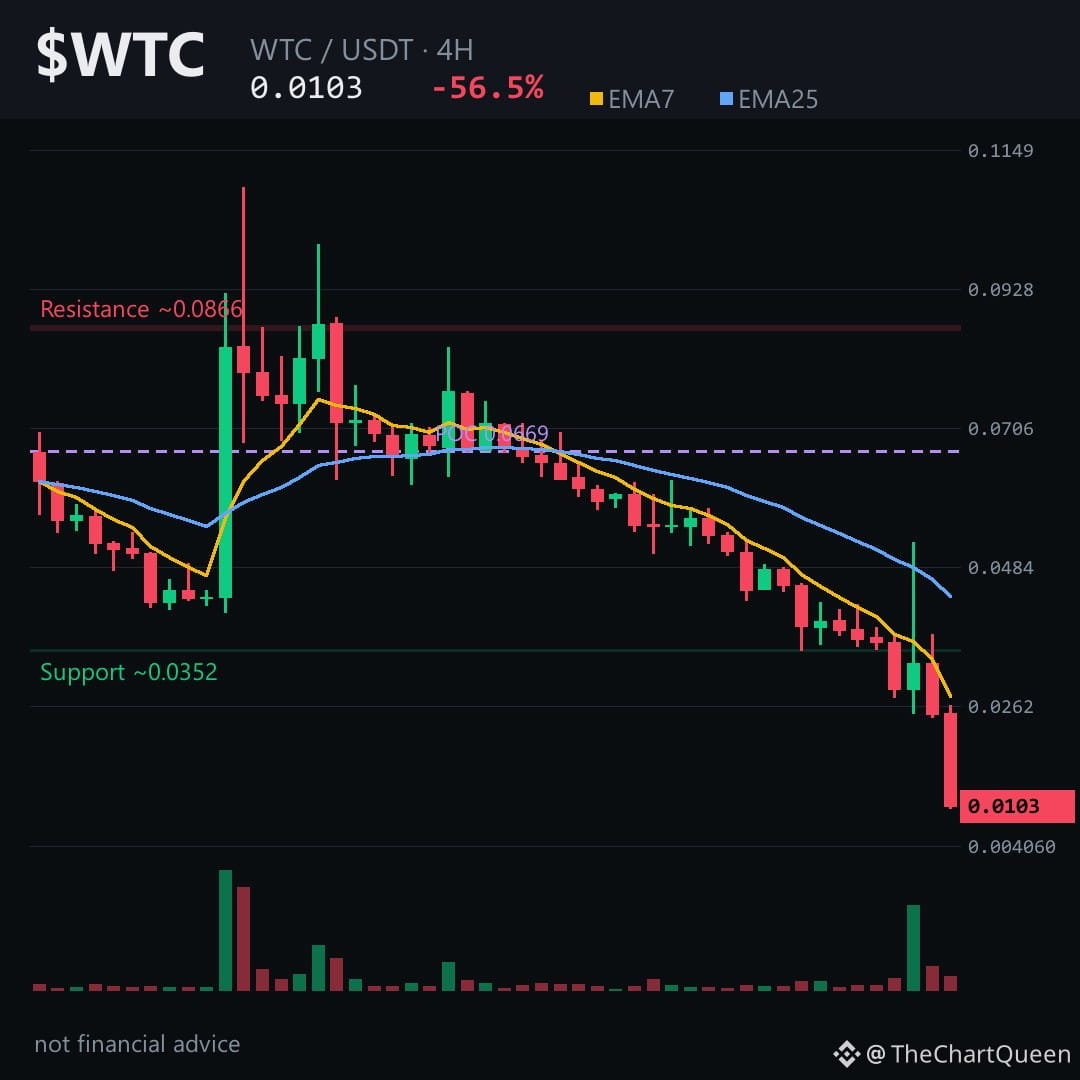
Did you spot $WTC’s 4‑hour candle hugging the 0.0103 line while the EMA7 (≈0.028) sits well below EMA25 (≈0.043)? That tiny gap hints at a hidden downside. 👀
Price is already under the short‑term EMA and the RSI is stuck around 20, a textbook oversold signal, yet the candle count (9 reds vs 3 greens) tells us sellers still dominate.
On the 4H chart the current area sits near 0.0103. If $WTC falls through the ~0.0094 pocket, the bearish story plays out; a close above the ~0.0109 zone would wipe the read clean. Tap $WTC to pull up the chart and see these zones yourself.
My read: expect pressure toward the ~0.0094 zone; a break above 0.0109 would flip the narrative.
Follow for the next update when WTC either punches through the 0.0109 ceiling or slides into the 0.0094 floor.
Where do you see the strongest support for WTC – the 0.0094 pocket or the 0.0109 barrier? 👇
⚠️ Not financial advice. DYOR.
#WTC #Crypto #BinanceSquare #TopLoser #Analysis
Price is already under the short‑term EMA and the RSI is stuck around 20, a textbook oversold signal, yet the candle count (9 reds vs 3 greens) tells us sellers still dominate.
On the 4H chart the current area sits near 0.0103. If $WTC falls through the ~0.0094 pocket, the bearish story plays out; a close above the ~0.0109 zone would wipe the read clean. Tap $WTC to pull up the chart and see these zones yourself.
My read: expect pressure toward the ~0.0094 zone; a break above 0.0109 would flip the narrative.
Follow for the next update when WTC either punches through the 0.0109 ceiling or slides into the 0.0094 floor.
Where do you see the strongest support for WTC – the 0.0094 pocket or the 0.0109 barrier? 👇
⚠️ Not financial advice. DYOR.
#WTC #Crypto #BinanceSquare #TopLoser #Analysis