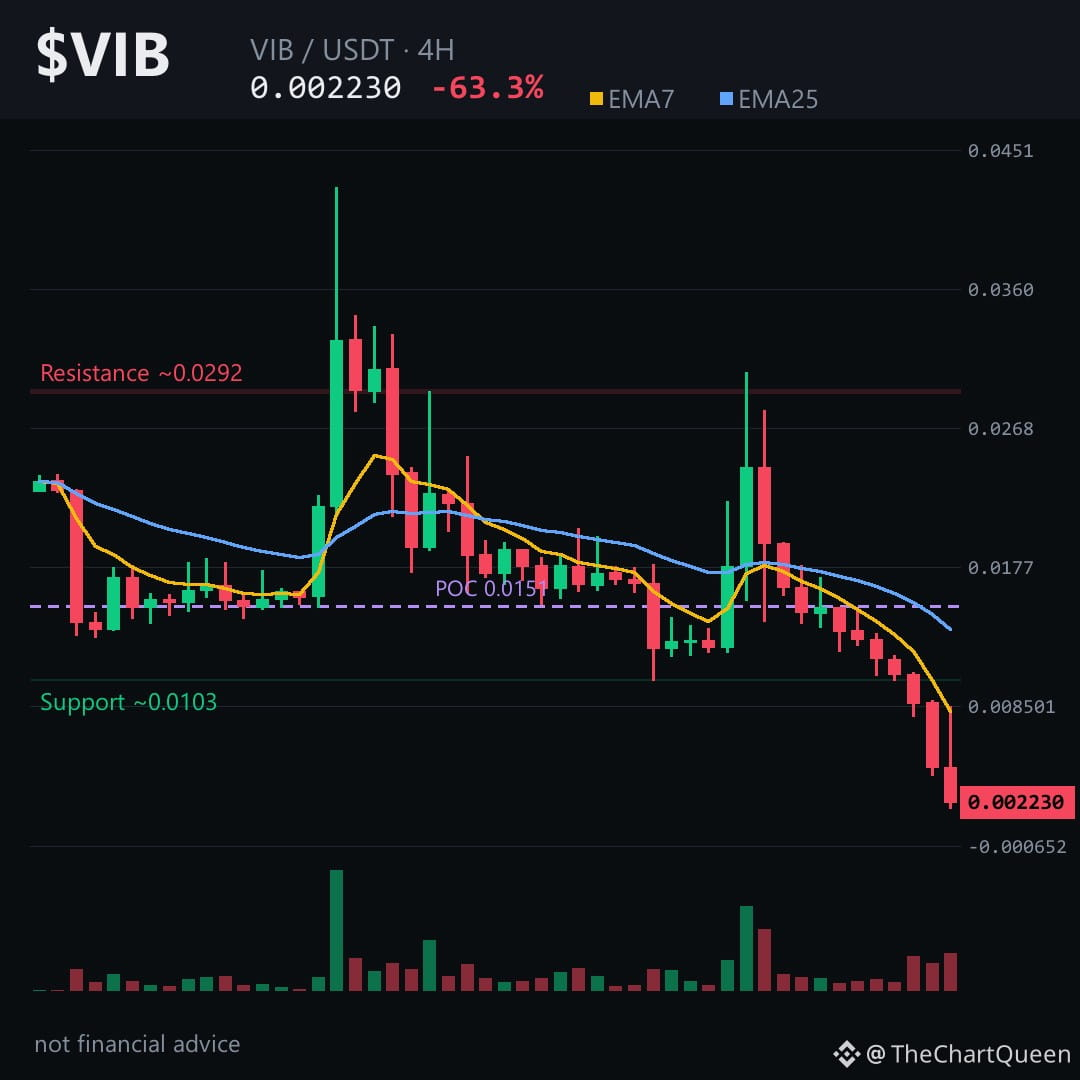
0.00223 is the lowest point of a 24‑hour plunge that wiped out 63% of $VIB’s value – and the next candle could lock in the damage.
Read the hidden trap below 👇
Price is slumping, but the EMA gap and a bearish FVG hint the downside may still have room. The RSI sitting in the high‑20s suggests sellers are still in control.
On the 4‑hour chart the current area clusters around the ~0.00224 zone. The line in the sand sits just above at ~0.00235 – break that and the bearish case crumbles. If $VIB holds below the ~0.00235 area, the next logical drop heads toward the ~0.00204 objective. Tap $VIB to pull up the chart and see these zones yourself.
My read is that the market will test the ~0.00235 barrier; losing it would flip the bias, while staying under keeps the downtrend alive.
Follow me for the next update when the price either respects or shatters that level – you’ll see the next move before the crowd catches on.
What do you think VIB will do around the ~0.00235 line? 👇
⚠️ Not financial advice. DYOR.
#VIB #Crypto #BinanceSquare
Read the hidden trap below 👇
Price is slumping, but the EMA gap and a bearish FVG hint the downside may still have room. The RSI sitting in the high‑20s suggests sellers are still in control.
On the 4‑hour chart the current area clusters around the ~0.00224 zone. The line in the sand sits just above at ~0.00235 – break that and the bearish case crumbles. If $VIB holds below the ~0.00235 area, the next logical drop heads toward the ~0.00204 objective. Tap $VIB to pull up the chart and see these zones yourself.
My read is that the market will test the ~0.00235 barrier; losing it would flip the bias, while staying under keeps the downtrend alive.
Follow me for the next update when the price either respects or shatters that level – you’ll see the next move before the crowd catches on.
What do you think VIB will do around the ~0.00235 line? 👇
⚠️ Not financial advice. DYOR.
#VIB #Crypto #BinanceSquare