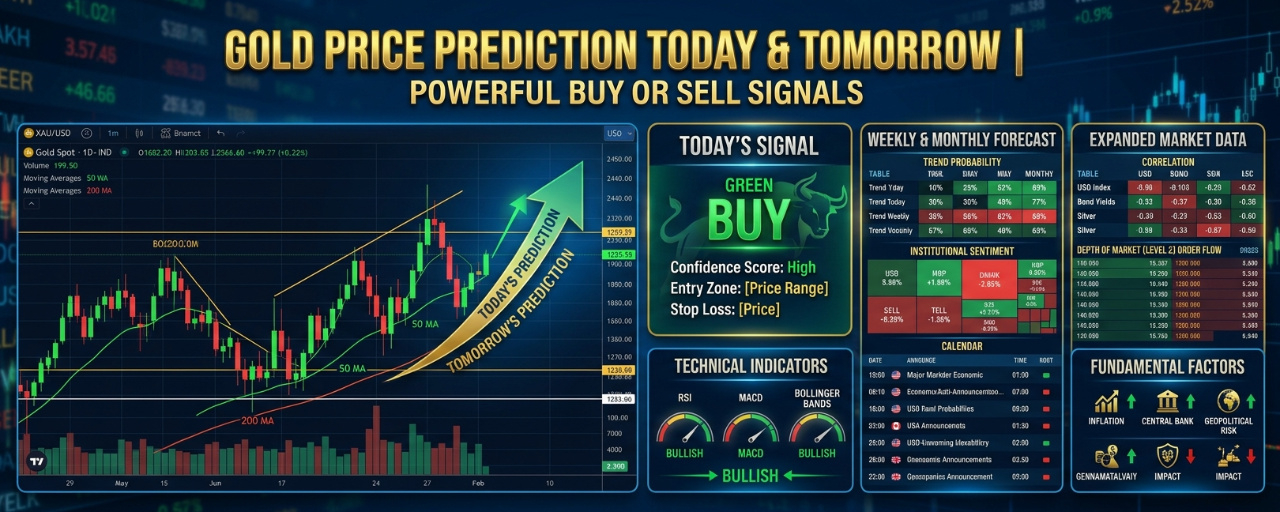


📊 Gold Market Analysis – November 11, 2026
XAU/USD | Day Trading | 15-Minute Chart | USD
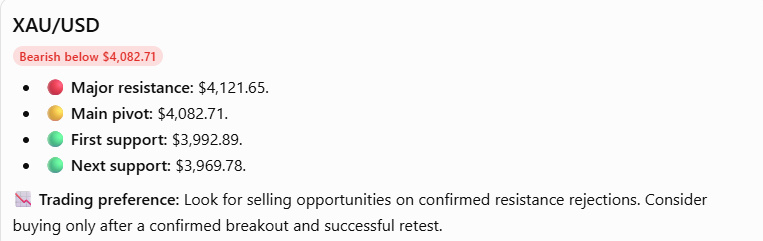
Short-term bearish bias
📉 Today's Gold Market Overview
Gold is attempting to recover after a sharp sell-off. Stronger US inflation and expectations of higher interest rates are putting pressure on gold.
💰 Reference gold price: approximately $4,034–$4,045.
📉 Previous session: Significant decline.
⚠️ Market sentiment: Cautious and volatile.
🇺🇸 Main influences: US dollar, Treasury yields and Federal Reserve policy.
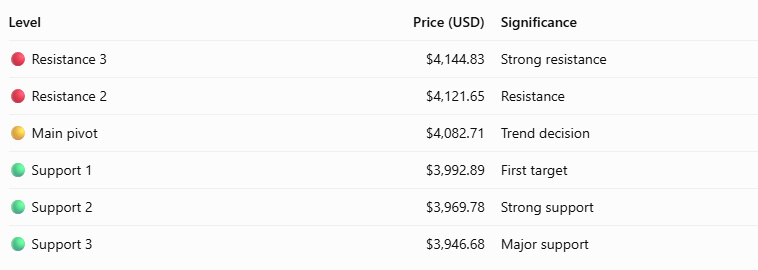
🎯 Key Support & Resistance Levels
📊 15-Minute Candlestick Analysis
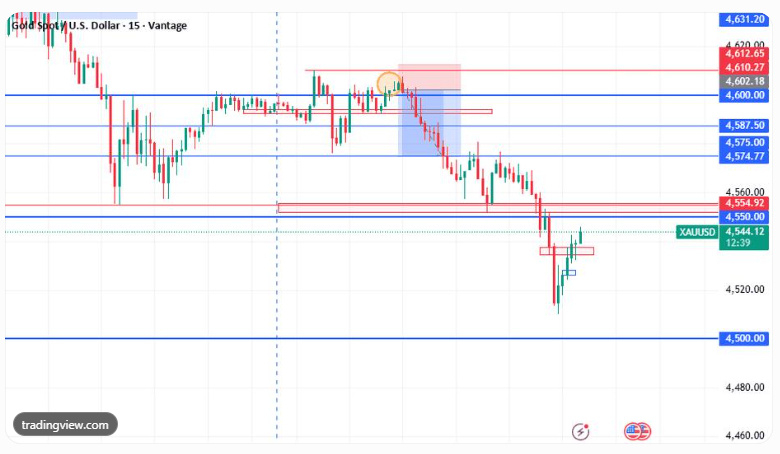
🔴 Bearish engulfing: Potential selling opportunity.
🟢 Bullish engulfing: Potential buying opportunity.
🔴 Long upper wick: Selling pressure.
🟢 Long lower wick: Buying interest.
📈 Strong candle close above resistance: Potential bullish breakout.
Select the 15-minute timeframe for intraday analysis.
💹 Today's Trading Strategies
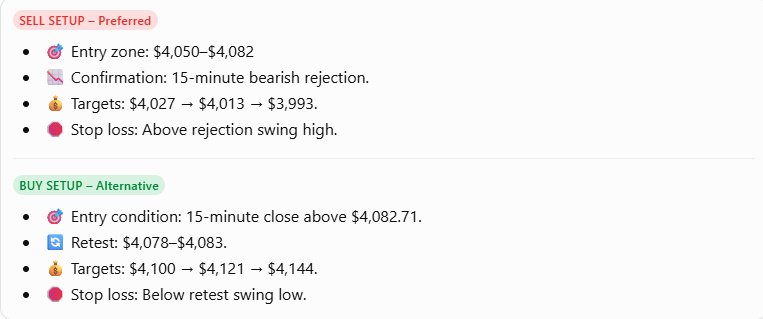
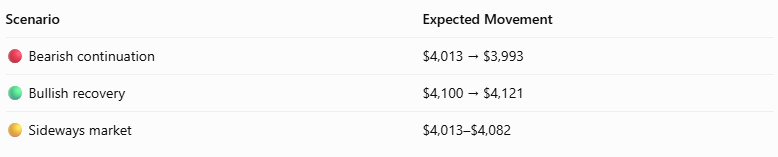
🔮 Tomorrow's Gold Outlook – November 12
🇺🇸 Monitor US Initial Jobless Claims.
💵 Watch the US Dollar Index (DXY).
📊 Monitor US Treasury yields.
⚠️ Expect potential volatility around economic announcements.
🌍 Best Trading Sessions – Pakistan Time
🌏 Asian session: 5 AM–1 PM.
🇬🇧 London session: 1 PM–9 PM.
🇺🇸 New York session: 6 PM–3 AM.
🔥 London–New York overlap: Particularly important for breakout opportunities.
🛡️ Risk Management
💰 Risk per trade: 0.5–1%.
⚠️ Maximum daily loss: 2%.
📈 Minimum risk/reward: 1:2.
🛑 Always use a stop loss.
🚫 Avoid emotional and revenge trading.
🎯 Wait for candle-close confirmation before entering.
📌 Final Gold Trading Outlook
⚠️ Prices are reference levels, not guaranteed entries. Verify live broker prices before trading.