
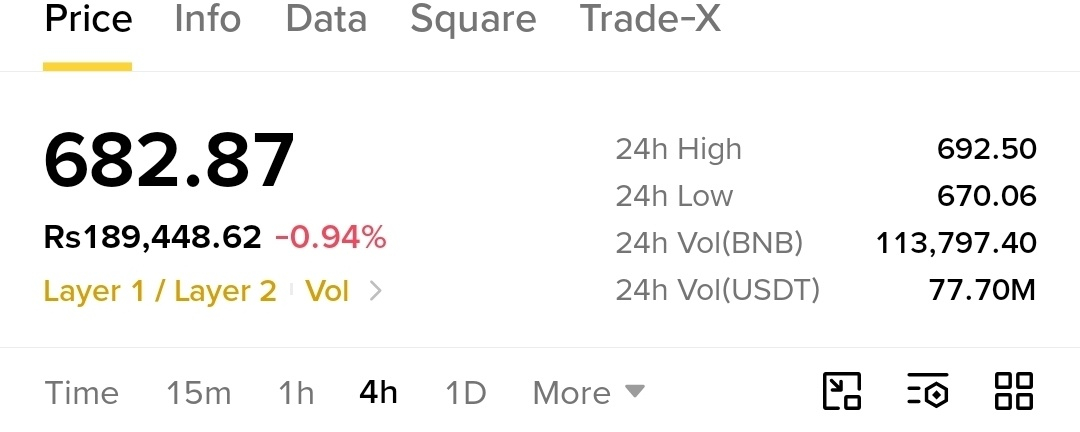


BNB is trading at $682.80 on November 11, 2026. My risk view is that the evidence supports caution, not a confident directional call: the daily and 4-hour trends are down, while the weekly structure is still classified as ranging. The next useful evidence is whether completed candles hold near support or reclaim resistance—not a forecast based on an unfinished candle.
Bearish scenario: Recent daily closes have generally weakened, and price remains below the daily EMA20 ($706.01) and EMA50 ($718.57). It is also below the 4-hour EMA20 ($687.44) and EMA50 ($695.41). Daily RSI is 38.9. These facts support weak momentum, but RSI alone does not prove that a fall will continue. The current daily candle is unfinished; its intraday low of $677.92 does not establish a confirmed breakdown.
The nearest support reference is $680.84, followed on the 4-hour chart by $678.13 and $673.21. The bearish case would strengthen if completed candles close below these nearby levels and fail to reclaim them, particularly alongside evidence of broader selling or sustained weakness in BNB-linked activity. The weekly supports at $601.40 and $570.80 are further reference points, not predicted destinations. The bearish setup would weaken if price holds support and reclaims the nearby resistance band.
Bullish scenario: The case for a recovery rests on support holding and price progressively reclaiming resistance—not on the small gain in the current, unfinished candle. The first relevant resistance is $687.70 on the weekly chart; above that, the 4-hour levels are $692.64, $699.55, and $702.00. A stronger signal would be completed candles above these levels, followed by a sustained move through the daily EMA20 at $706.01, with buying participation supporting the move. That would weaken the near-term bearish reading; it would not by itself prove a lasting trend reversal. The bullish case would fail if price closes below nearby support and cannot recover it.
Ecosystem indicators provide some context but do not settle the price question. BNB Chain reported 4.86M active addresses in 24 hours, and Binance users reportedly held more than $3B in tokenized assets. These figures indicate activity and use, but do not establish that activity is growing sustainably, that it creates measurable value for BNB holders, or that it caused today’s price action. The current move could also reflect broad market weakness, ordinary position unwinding, or BNB-specific selling; the evidence available does not isolate the cause.
Derivatives are mixed rather than decisive. Perpetual open interest was $641M across 4 venues, with roughly 81% at Binance. OKX open interest fell 1.2% in 24 hours and 17.7% in 7 days, but that is venue-specific and cannot establish a market-wide reduction in leverage. Open-interest-weighted funding was slightly positive at 0.004% per 8 hours, meaning longs pay shorts modestly; this is not evidence on its own of crowded longs or an imminent squeeze. The OKX account long/short ratio was 2.87, while top-trader account and position ratios were 0.95 and 0.91—a split that warrants caution but does not identify the next move. Dated futures basis was −7.9% annualised across 2 contracts, another counter-signal. Liquidation data are unavailable, so we cannot tell whether forced selling or short covering is materially driving price.
News adds risk, but not proof of a direct price cause. Reporting says about $891M of stolen funds may have been moved or laundered; Binance says it has reimbursed nearly 95% and is arranging an independent security review. This raises security and trust concerns, but does not demonstrate that BNB demand or Binance activity has already suffered a sustained decline. Evidence of new security failures, access restrictions, or persistent deterioration in platform and chain activity would strengthen the bearish risk case. A credible review with effective fixes and resilient activity would reduce that concern, though it would not guarantee price recovery.
For a trader, the key signal is the daily close relative to $680.84 support and the $687.70–$702.00 resistance band, with volume and market-wide positioning used as confirmation rather than substitutes for price. Avoid treating an intraday move through a level as confirmation; size positions for volatility, define invalidation before entry, and avoid adding risk simply because price is near support. The current evidence supports a weak short-term picture inside a broader weekly range. It does not prove a breakdown, a recovery, or what caused the move.