$KORUB : Why Does the Crowd Cheer at the Hardest Barrier?
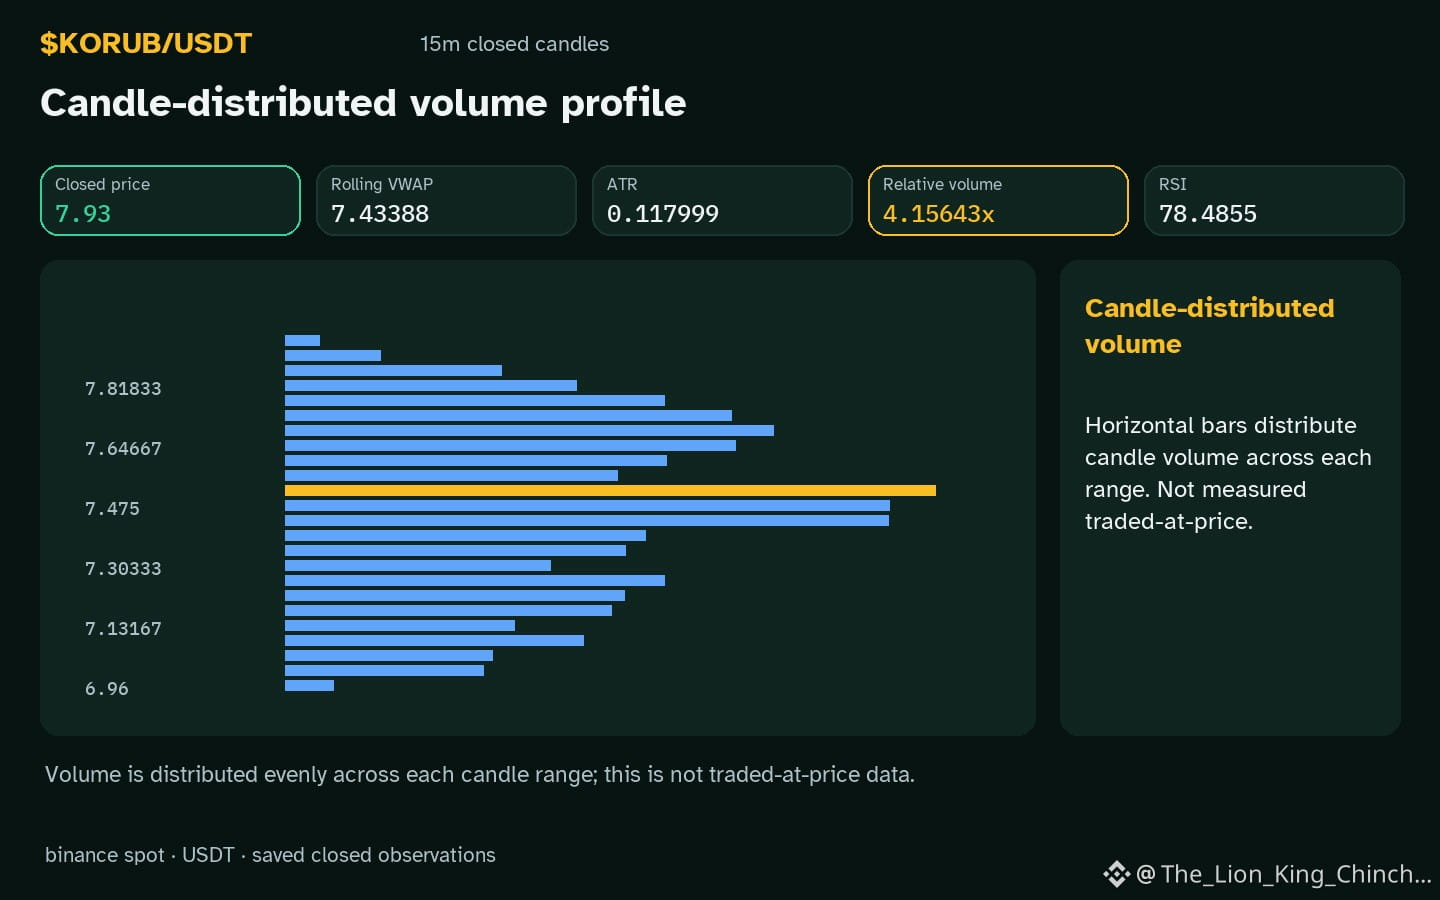
$KORUB shows an hourly up direction while volume sits above baseline and price sits above resistance. Why does enthusiasm appear strongest exactly where the market may be most fragile? This question highlights the anchoring bias: traders latch onto the most recent upward move and treat it as a new reference point, ignoring earlier structural limits.
The observation that the range sits above resistance suggests that price is testing a level that historically acted as a ceiling. Yet the surge in attention and trading volume can create a false sense of security. When participants focus on the latest breakout, they may underestimate the likelihood of a pull‑back, because the new high becomes the mental anchor for future expectations.
A practical self‑check is to pause and ask: "If I ignored the recent rally and looked only at the prior resistance, would my view change?" Write down the original support and resistance levels (7.12 and 7.84) and compare them to the current price 7.93. If the gap is large, consider that the enthusiasm might be overstated.
A counterexample helps illustrate the bias. Imagine a coin that climbs past resistance but then consolidates below the same level for several hours despite high volume. In that scenario, the crowd’s focus on the breakout would have misled them.
Remember that the bias does not guarantee a reversal; it merely reminds us to broaden the reference frame. Revisiting the original structural levels and checking whether volume is truly supportive (4.15643) can reduce over‑confidence and improve decision quality.
What other anchors might be shaping your view today?
Probabilistic market research, not a recommendation or guaranteed return.
The reference point or the full picture?
#KORUB #TradingPsychology
$KORUB shows an hourly up direction while volume sits above baseline and price sits above resistance. Why does enthusiasm appear strongest exactly where the market may be most fragile? This question highlights the anchoring bias: traders latch onto the most recent upward move and treat it as a new reference point, ignoring earlier structural limits.
The observation that the range sits above resistance suggests that price is testing a level that historically acted as a ceiling. Yet the surge in attention and trading volume can create a false sense of security. When participants focus on the latest breakout, they may underestimate the likelihood of a pull‑back, because the new high becomes the mental anchor for future expectations.
A practical self‑check is to pause and ask: "If I ignored the recent rally and looked only at the prior resistance, would my view change?" Write down the original support and resistance levels (7.12 and 7.84) and compare them to the current price 7.93. If the gap is large, consider that the enthusiasm might be overstated.
A counterexample helps illustrate the bias. Imagine a coin that climbs past resistance but then consolidates below the same level for several hours despite high volume. In that scenario, the crowd’s focus on the breakout would have misled them.
Remember that the bias does not guarantee a reversal; it merely reminds us to broaden the reference frame. Revisiting the original structural levels and checking whether volume is truly supportive (4.15643) can reduce over‑confidence and improve decision quality.
What other anchors might be shaping your view today?
Probabilistic market research, not a recommendation or guaranteed return.
The reference point or the full picture?
#KORUB #TradingPsychology