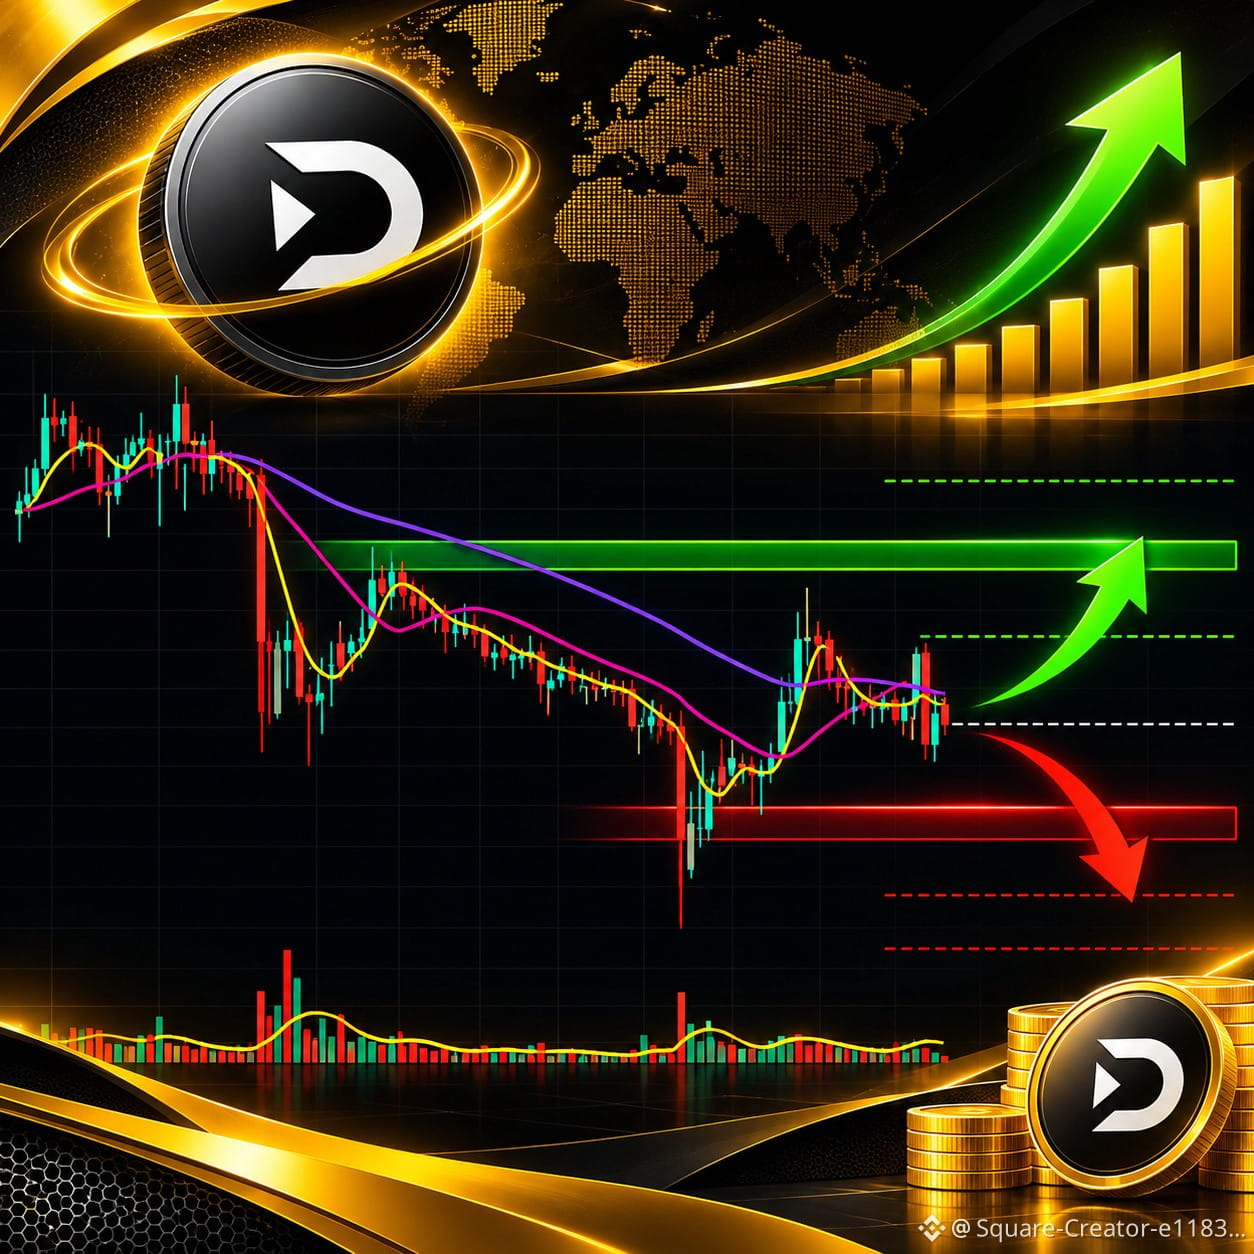
📊 DEXE/USDT – Technical Analysis | Binance
🔴 Current Market Situation
DEXE is currently trading around $1.254, down approximately 1.88%.
The chart shows continued bearish pressure after a recovery attempt from the $1.161 low. However, buyers are still struggling to regain control of the market.
📉 1. Trend Analysis
- MA(7): $1.265
- MA(25): $1.268
- MA(99): $1.271
The price is trading below all three moving averages, indicating that the short-term trend remains bearish.
📍 2. Key Support Levels
- $1.243 – Immediate support.
- $1.210 – Secondary support.
- $1.161 – Major historical low on this chart.
🚀 3. Key Resistance Levels
- $1.265 – First resistance.
- $1.273 – Important resistance zone.
- $1.296 – Next upside target.
- $1.335 – Stronger resistance.
📈 4. Possible Market Scenarios
Bullish Scenario 🟢
A strong breakout above $1.273 with increasing trading volume could open the door toward $1.296, followed by $1.335.
Bearish Scenario 🔴
A breakdown below $1.243 could increase selling pressure and push the price toward $1.210. A deeper correction could retest $1.161.
🎯 5. Trading Outlook
The market currently favors caution. Buyers need to reclaim the $1.273 resistance zone before a stronger bullish reversal can be considered.
My conclusion:
DEXE is at a critical technical zone. The next move will depend on whether buyers can defend support and break through nearby resistance.
🔴 Current Market Situation
DEXE is currently trading around $1.254, down approximately 1.88%.
The chart shows continued bearish pressure after a recovery attempt from the $1.161 low. However, buyers are still struggling to regain control of the market.
📉 1. Trend Analysis
- MA(7): $1.265
- MA(25): $1.268
- MA(99): $1.271
The price is trading below all three moving averages, indicating that the short-term trend remains bearish.
📍 2. Key Support Levels
- $1.243 – Immediate support.
- $1.210 – Secondary support.
- $1.161 – Major historical low on this chart.
🚀 3. Key Resistance Levels
- $1.265 – First resistance.
- $1.273 – Important resistance zone.
- $1.296 – Next upside target.
- $1.335 – Stronger resistance.
📈 4. Possible Market Scenarios
Bullish Scenario 🟢
A strong breakout above $1.273 with increasing trading volume could open the door toward $1.296, followed by $1.335.
Bearish Scenario 🔴
A breakdown below $1.243 could increase selling pressure and push the price toward $1.210. A deeper correction could retest $1.161.
🎯 5. Trading Outlook
The market currently favors caution. Buyers need to reclaim the $1.273 resistance zone before a stronger bullish reversal can be considered.
My conclusion:
DEXE is at a critical technical zone. The next move will depend on whether buyers can defend support and break through nearby resistance.