
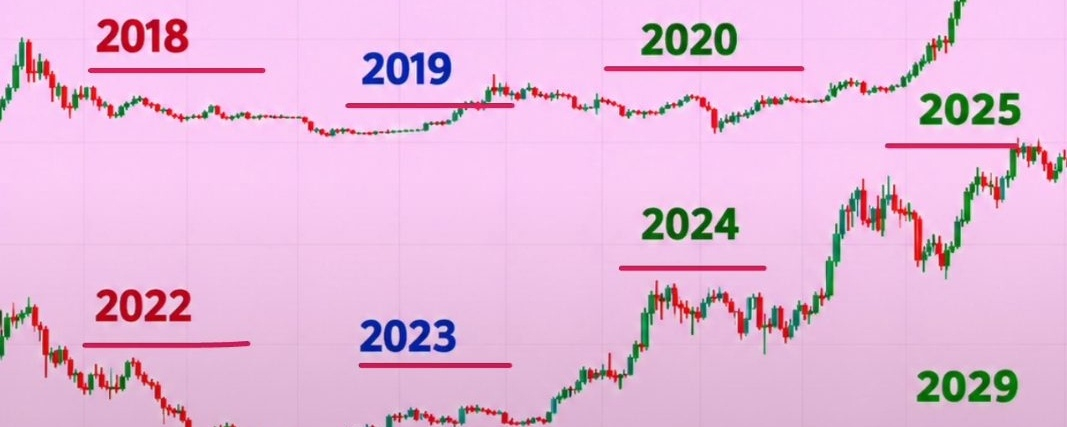

And almost nobody realizes what could happen in 2027.
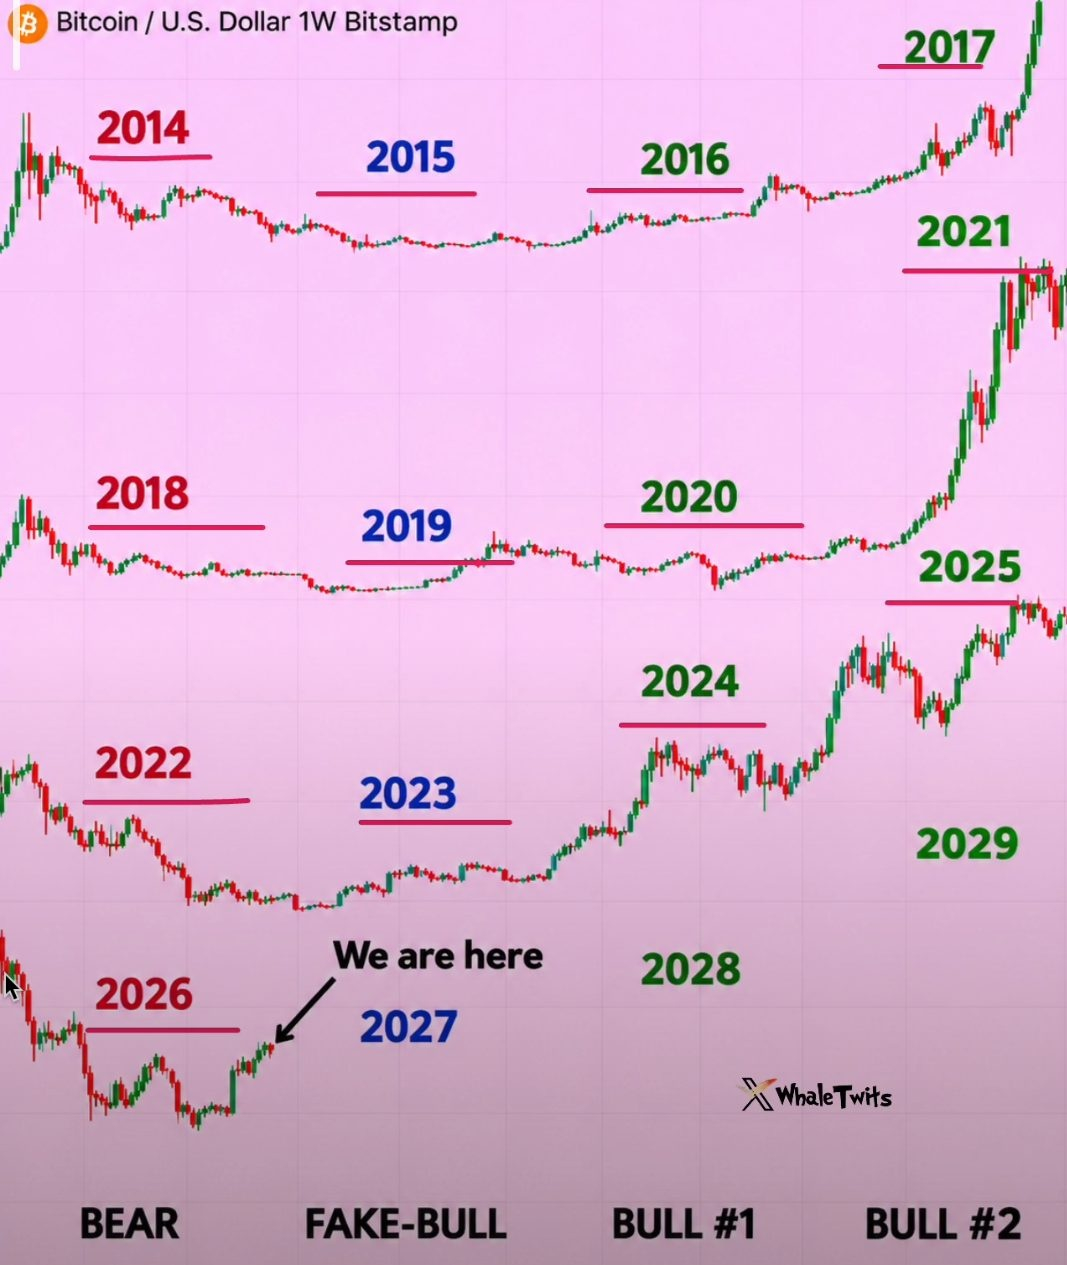
LOOK AT THIS CHART.
2014 → BEAR MARKET
2015 → RECOVERY
2016 → FIRST BULL PHASE
2017 → EXPLOSIVE RALLY
2018 → BEAR MARKET
2019 → RECOVERY
2020 → FIRST BULL PHASE
2021 → EXPLOSIVE RALLY
2022 → BEAR MARKET
2023 → RECOVERY
2024 → FIRST BULL PHASE
2025 → CYCLE TOP
2026 → BEAR MARKET
2027 → RECOVERY?
2028 → FIRST BULL PHASE?
2029 → NEW CYCLE TOP?
FOUR CYCLES. THE SAME FOUR-YEAR STRUCTURE.
And here's where things get interesting.
Every bear year on this chart coincides with U.S. midterm elections.
Every recovery year follows the midterms.
Every first bull phase coincides with a Bitcoin halving.
And the last three major cycle peaks arrived roughly 526, 548 and 534 days after their respective halvings.
THAT'S AN INCREDIBLY SIMILAR TIMELINE.
But two things have changed.
First, Bitcoin's latest drawdown was smaller.
Previous bear markets saw declines of roughly 77% to 85%.
This time, the decline to $58.6K was approximately 53% from the $126K peak.
Second, the correction happened much faster.
Previous cycle bottoms took around 363 to 406 days.
This time, $58.6K was reached just 268 days after the peak.
SO HERE'S THE MILLION-DOLLAR QUESTION.
WAS $58.6K ALREADY THE CYCLE BOTTOM?
Or is one final capitulation still coming?
I'm watching both scenarios.
Because if this four-year structure repeats, 2027 could become the accumulation year everyone talks about in hindsight.
And the next halving is expected around April 2028.
I'm not assuming history guarantees another bull market.
But I'm definitely not ignoring a pattern that has appeared across three completed cycles.
SAVE THIS CHART.
Come back in 2027.
Follow + turn notifications on.
I'll share my next major Bitcoin buying signal here FIRST.
THE BIGGEST OPPORTUNITIES DON'T ARRIVE WHEN EVERYONE IS BULLISH.
THEY ARRIVE WHEN ALMOST NOBODY BELIEVES THE NEXT CYCLE IS POSSIBLE.
#HotCPIDecemberHikePriced #AnthropicRejectsIPODelayValuationinQuestion #BitcoinFiveWeeklyLosses #US-IranTalksFuelStrongStockMarketRebound