$BTW USDT: Is This Recovery Strong Enough to Change the Trend?
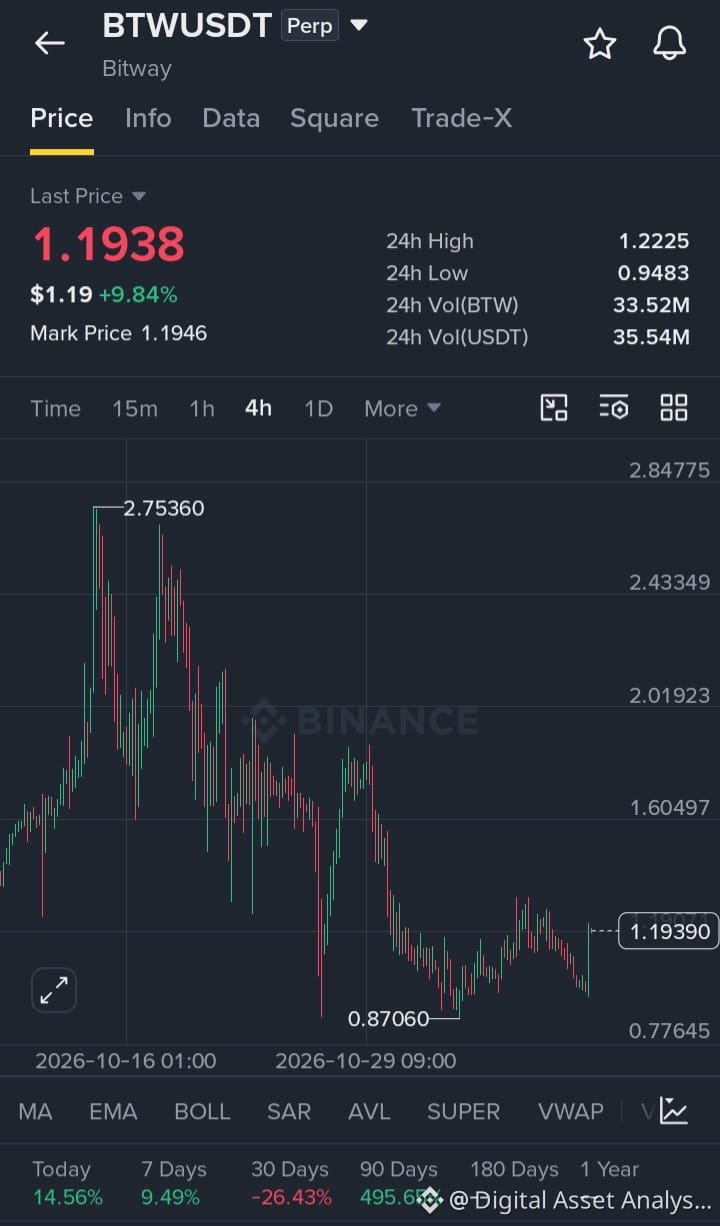
$BTW is showing a short-term recovery, but the 4H chart still has a bearish structure.
Market Structure: Price has been making lower highs and lower lows since the $2.75 peak. The recent bounce from $0.87060 shows buyers are becoming active, but a confirmed trend reversal is not visible yet.
Support: $0.87060 is the major visible swing low. A move back toward this area could attract liquidity and test buyer strength.
Resistance: Recent local highs are the first area buyers need to break. Stronger resistance remains above the current price.
Liquidity & Momentum: Liquidity may be sitting below the recent lows and above local swing highs. Price is now near $1.1938, while the 24H high is $1.2225.
My Outlook: A clean breakout above recent highs could support further recovery. Rejection may bring another move toward the lower range.
Question: Can buyers finally break the lower-high structure, or will sellers take control again?
Educational purposes only. Not financial advice.
$BTW is showing a short-term recovery, but the 4H chart still has a bearish structure.
Market Structure: Price has been making lower highs and lower lows since the $2.75 peak. The recent bounce from $0.87060 shows buyers are becoming active, but a confirmed trend reversal is not visible yet.
Support: $0.87060 is the major visible swing low. A move back toward this area could attract liquidity and test buyer strength.
Resistance: Recent local highs are the first area buyers need to break. Stronger resistance remains above the current price.
Liquidity & Momentum: Liquidity may be sitting below the recent lows and above local swing highs. Price is now near $1.1938, while the 24H high is $1.2225.
My Outlook: A clean breakout above recent highs could support further recovery. Rejection may bring another move toward the lower range.
Question: Can buyers finally break the lower-high structure, or will sellers take control again?
Educational purposes only. Not financial advice.