🔥 $SPCXB Technical Update: Key Levels & Momentum Breakdown
📊 1. Market Snapshot
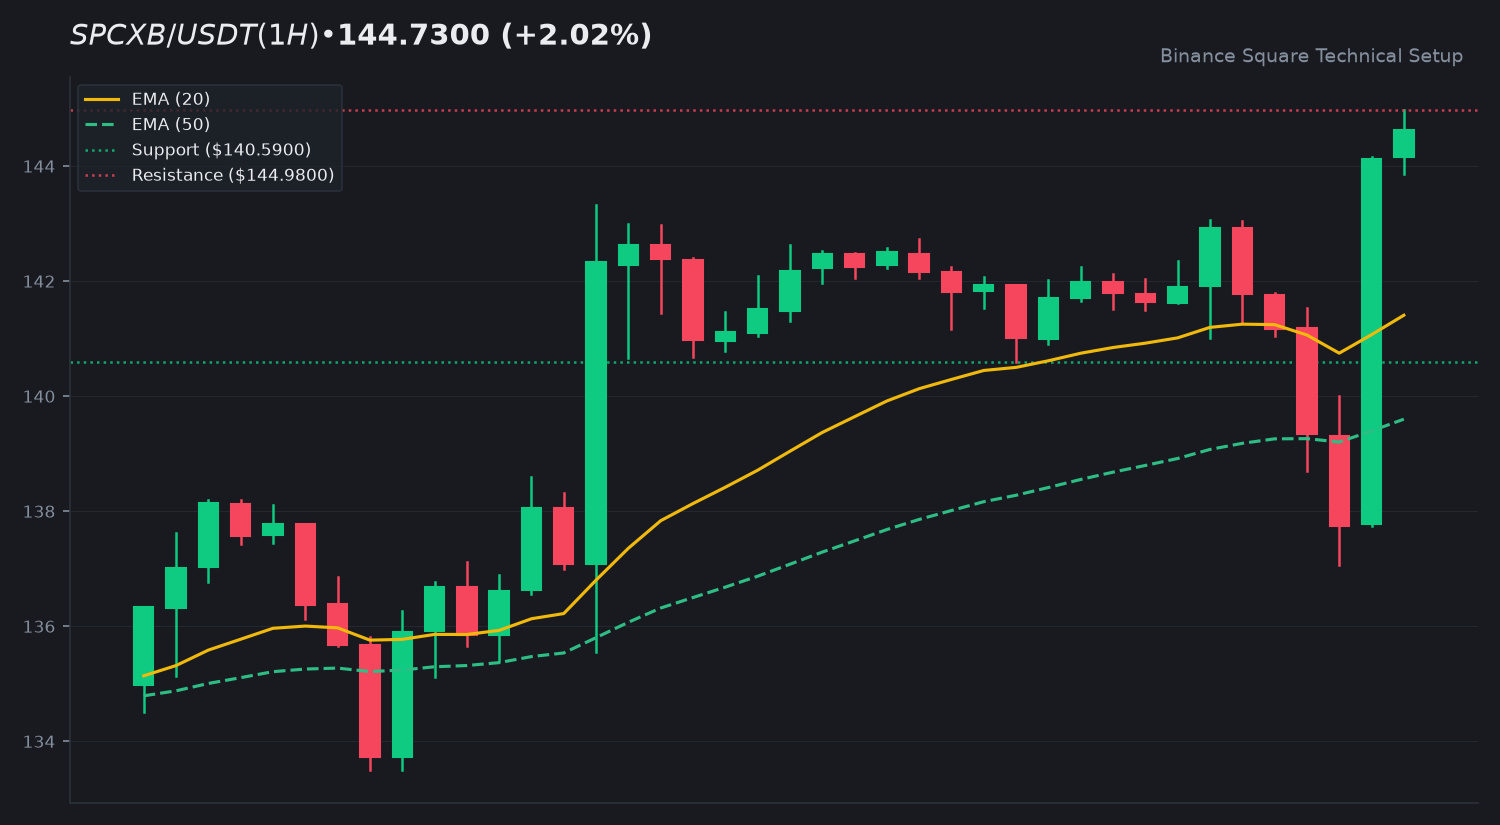
The asset $SPCXB is currently trading at 144.7300 USDT, reflecting a 24h increase of 2.02 percent. Market activity remains steady with a 24h quote volume of 27,676,929 USDT. Current price action shows the asset hovering near its daily high of 144.9800 USDT.
📈 2. Technical Momentum & Indicator Bias
The trend posture remains constructive as the price holds above the EMA 20 at 141.4076 and the EMA 50 at 139.6006. The RSI at 62.33 indicates moderate bullish momentum without reaching overbought territory. The MACD histogram is at -0.0456, showing the MACD line slightly below the signal line, suggesting a period of consolidation or a slight cooling of momentum despite the broader uptrend.
🎯 3. Key Technical Levels to Watch
• 🟢 Resistance Zone: 144.9800 is the immediate ceiling. A clean break above this could shift the technical outlook.
• 🔴 Support Zone: 140.5900 acts as the primary support floor, followed by 134.2329 as the secondary level.
• 🛡️ Pivot Confluence: The EMA 20 at 141.4076 serves as the vital pivot for short-term trend maintenance.
💡 4. Technical Takeaway & Risk Management
Price action is currently testing the upper bounds of the recent range. Traders are monitoring the relationship between the price and the EMA 20. Sustained trading above this EMA supports the current bullish trend, while a move below may invite a retest of lower support levels.
💬 5. Community Discussion
What is your technical outlook for $SPCXB this week? Are you accumulating or waiting for confirmation? Drop your thoughts below! 👇
⚠️ 6. Disclaimer
Educational technical analysis only. Not financial advice (NFA). Crypto markets involve risk. Always DYOR.
$SPCXB #SPCXB #BinanceSquare
📊 1. Market Snapshot
The asset $SPCXB is currently trading at 144.7300 USDT, reflecting a 24h increase of 2.02 percent. Market activity remains steady with a 24h quote volume of 27,676,929 USDT. Current price action shows the asset hovering near its daily high of 144.9800 USDT.
📈 2. Technical Momentum & Indicator Bias
The trend posture remains constructive as the price holds above the EMA 20 at 141.4076 and the EMA 50 at 139.6006. The RSI at 62.33 indicates moderate bullish momentum without reaching overbought territory. The MACD histogram is at -0.0456, showing the MACD line slightly below the signal line, suggesting a period of consolidation or a slight cooling of momentum despite the broader uptrend.
🎯 3. Key Technical Levels to Watch
• 🟢 Resistance Zone: 144.9800 is the immediate ceiling. A clean break above this could shift the technical outlook.
• 🔴 Support Zone: 140.5900 acts as the primary support floor, followed by 134.2329 as the secondary level.
• 🛡️ Pivot Confluence: The EMA 20 at 141.4076 serves as the vital pivot for short-term trend maintenance.
💡 4. Technical Takeaway & Risk Management
Price action is currently testing the upper bounds of the recent range. Traders are monitoring the relationship between the price and the EMA 20. Sustained trading above this EMA supports the current bullish trend, while a move below may invite a retest of lower support levels.
💬 5. Community Discussion
What is your technical outlook for $SPCXB this week? Are you accumulating or waiting for confirmation? Drop your thoughts below! 👇
⚠️ 6. Disclaimer
Educational technical analysis only. Not financial advice (NFA). Crypto markets involve risk. Always DYOR.
$SPCXB #SPCXB #BinanceSquare