

This chart is showing something most investors aren't paying attention to
We're looking at the S&P 500 adjusted for M2 money supply
It's revealing how the market performs relative to the expansion of money
And the historical parallels are pretty wild:
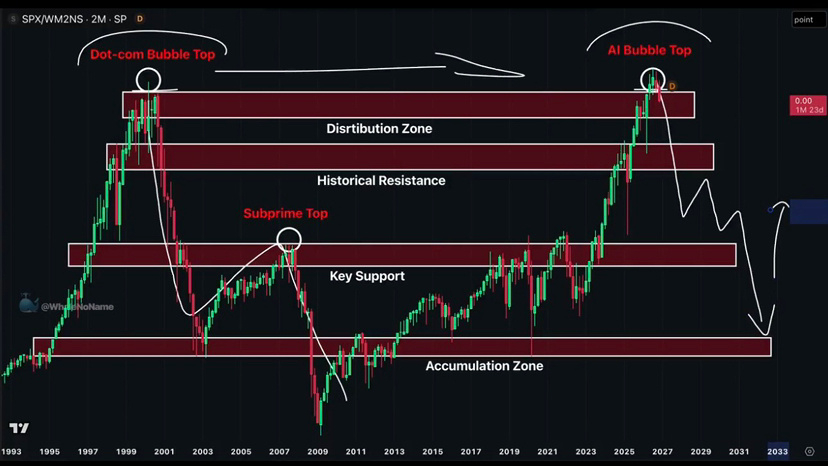
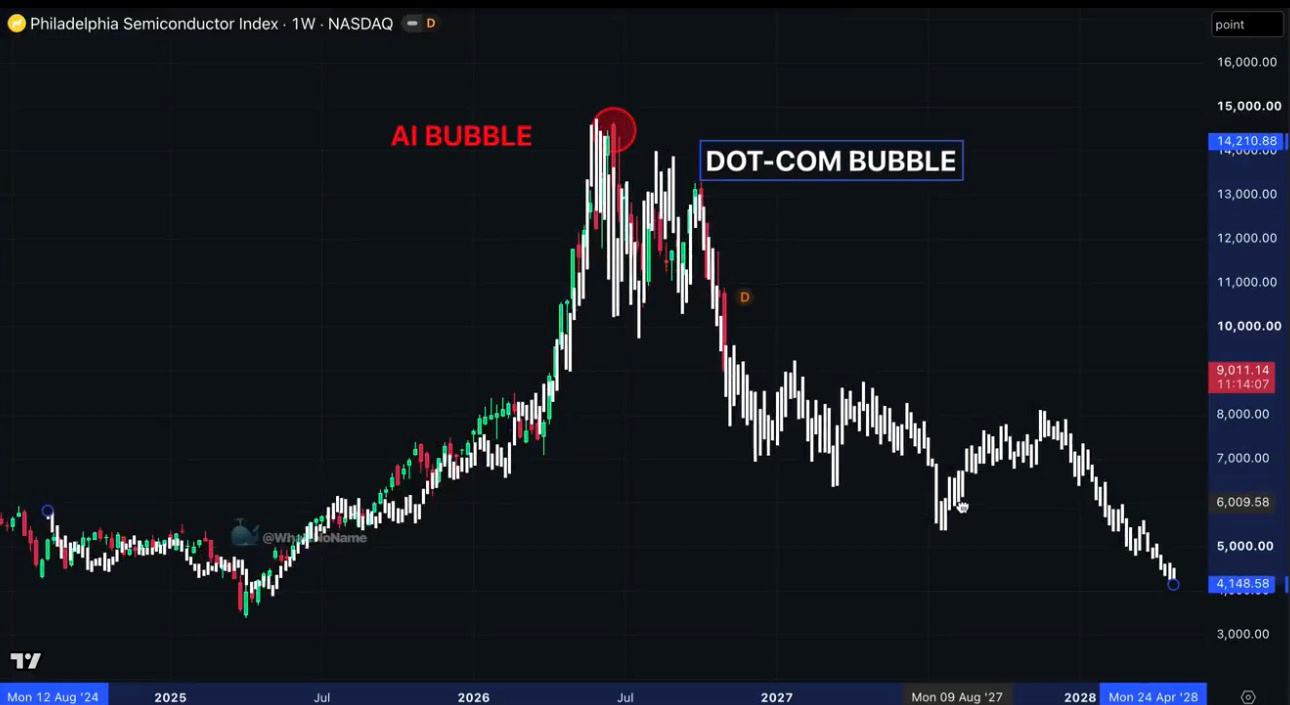
2000: Dot-com bubble top
2007: Subprime bubble top
2026: AI bubble approaching the same territory
Two of the biggest market bubbles peaked in this distribution zone
Now we're back there again
The difference? This time, the AI boom is driving expectations to extreme levels
I'm not saying history has to repeat itself
But when the same long-term resistance keeps showing up across different market cycles, ignoring it is a mistake.
#CPITestsDecemberRateOutlook #AnthropicRejectsIPODelayValuationinQuestion #NvidiaInvestigatesAfterHuang’sAffairApology #BitcoinFiveWeeklyLosses #AIChipSlumpNasdaq