

As the global market faces a crucial junction, a new analysis of Bitcoin’s long-term price action, from its inception in 2023 to the current date, November 9, 2026, reveals a complex yet promising story for investors, with potential for an all-time high.
#BTC #Bitcoin #Crypto #TechnicalAnalysis #MarketCycle #PricePrediction #CryptoNews
The Journey: Retracing from 2023's 'START'
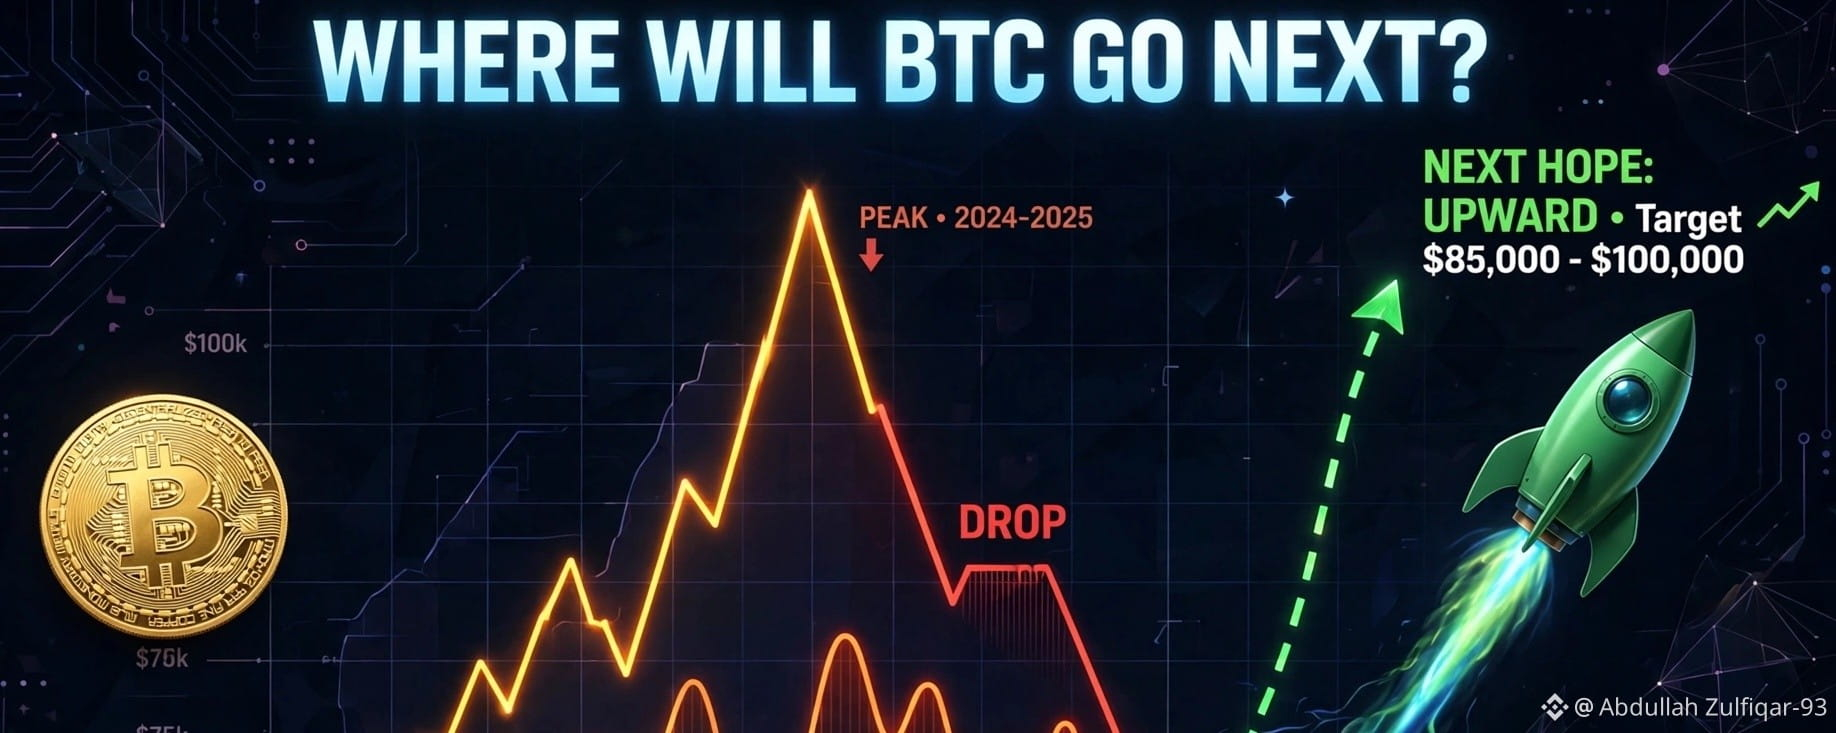
Our technical map, titled "WHERE WILL BTC GO NEXT?", provides a visually arresting overview of the past four years. The journey begins with a modest 'START' in 2023, with BTC hovering near the $25k level. What followed was a highly 'VOLATILE' era. The orange price line paints a picture of constant 'UPS & DOWNS', as the market struggled for a definitive direction, a phase characterized by consolidation and sudden, dramatic shifts.
2024-2025: The 'PEAK' and the Sudden 'DROP'
The cycle reached its zenith between 2024 and 2025, where a powerful surge propelled the price to a critical 'PEAK'. While the exact figure isn't annotated, the visual peak lies just below the major $100k resistance line, an emotional and psychological barrier. This monumental high, labeled as a 'NEXT HOPE: UPWARD' target, was short-lived.
A sharp, painful, and widely publicized 'DROP' ensued, sending the market into a tailspin. This period is still a fresh memory for many and represents the classic 'crash' phase of a market cycle, where euphoria turned to fear. The 'DROP' erased a significant portion of the 'PEAK' gains, bringing Bitcoin back to reality and, momentarily, into a period of extreme doubt.
'NOW': November 9, 2026 — A Price of $74,147
This brings us to 'NOW,' a snapshot taken on November 9, 2026, with Bitcoin trading at precisely $74,147. The price is a symbol of resilience, a full recovery from the 'DROP' that has now transformed into a launching pad. We are no longer in the highly volatile zone. Instead, the red price line has been replaced by a bright, cyan-glowing beacon and a decisive, green-dashed trajectory.
The Forecast: 'NEXT HOPE: UPWARD' and a Rocket Launch
The core of this analysis is forward-looking. A new paradigm has emerged: 'FUTURE: HOPE UP'. The orange-to-red volatility is a relic of the 'PAST: UPS & DOWNS'.
The green-dashed line points explicitly upward, accompanied by an icon that leaves no room for ambiguity: a green rocket ship, engines blazing, labeled as a symbol of 'Target $85,000 - $100,000'.
For a seasoned technical analyst, the interpretation is clear:
Support and Resistance: The 'DROP' established a firm, long-term support level. The recent recovery to $74,147 demonstrates strong buying interest, turning previous resistance into a launchpad.
Trend Change: The transition from orange/red lines to green dashed lines signals a definitive change in long-term trend, from volatile and bearish to sustained bullish.
Fibonacci Extensions: While not drawn, a rocket icon to $100k often aligns with key Fibonacci extension levels from the previous all-time high.
Sentiment Shift: The very language of the chart—moving from 'VOLATILE' and 'DROP' to 'HOPE' and 'ROCKET'—is a textbook example of a sentiment-based technical analysis, predicting a self-fulfilling prophecy.
Conclusion: For Educational Purposes Only
While this visual summary provides a powerful psychological and technical argument for an upward surge, all investors must remember the small print: 'FOR EDUCATIONAL PURPOSES ONLY'. Past performance is not indicative of future results, and no chart can account for black swan events, regulatory changes, or macroeconomic shifts. However, for those with 'HOPE' and an analytical mindset, the chart on November 9, 2026, presents a very clear message: the 'PAST' volatility is over, and the 'FUTURE' rocket is preparing for launch.
🚩 THE PAST: GONE, BUT NOT FORGOTTEN 🚩
In honor of the 'DROP' that shook the world in 2025, we revisit the banners of despair from that historical market correction.
FLASHBACK: 2025 BTC CRASH BANNERS