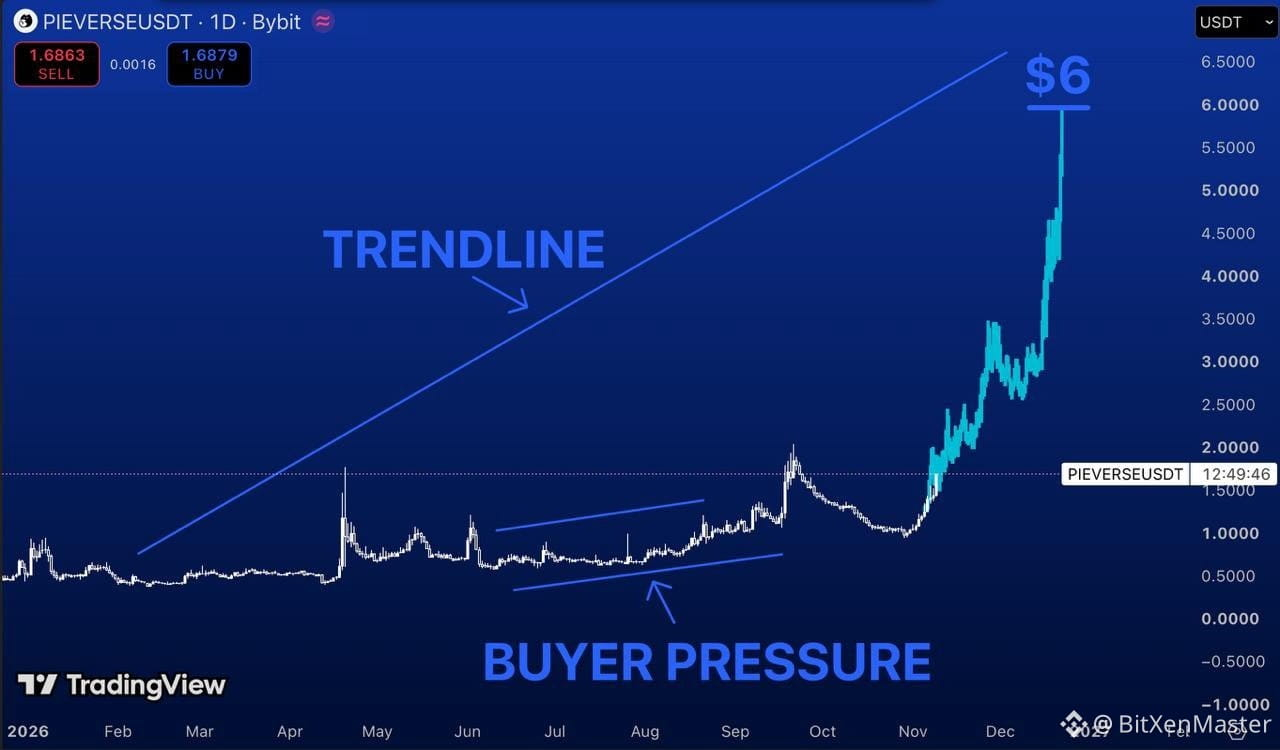
$PIEVERSE is trading around $1.69.
And unlike most altcoins, this chart is actually showing signs of strength.
Look at the daily timeframe.
After months of consolidation, buyers started stepping in around $0.50–0.70.
Higher lows began forming. Selling pressure weakened.
Then price broke out and made a strong move toward $2.
What's interesting is the structure behind that move.
We're no longer looking at a coin stuck in a downtrend.
We're looking at an asset attempting to establish a new bullish trend.
Here's what I'm watching.
$2 - The first major resistance to reclaim.
$3–3.50 - The next area where sellers could step in.
$4.50 - A potential continuation target.
And $6? That's my aggressive bull scenario.
The chart illustrates a possible move toward the upper trendline, but that doesn't make the target guaranteed.
I want to see $PIEVERSE hold above $1.50 and continue building higher lows.
Lose that structure, and the bullish thesis starts weakening.
Because the most important part of this chart isn't the $6 target.
It's whether buyers can keep control after the initial breakout.
And right now, that's exactly what I'm watching.
And unlike most altcoins, this chart is actually showing signs of strength.
Look at the daily timeframe.
After months of consolidation, buyers started stepping in around $0.50–0.70.
Higher lows began forming. Selling pressure weakened.
Then price broke out and made a strong move toward $2.
What's interesting is the structure behind that move.
We're no longer looking at a coin stuck in a downtrend.
We're looking at an asset attempting to establish a new bullish trend.
Here's what I'm watching.
$2 - The first major resistance to reclaim.
$3–3.50 - The next area where sellers could step in.
$4.50 - A potential continuation target.
And $6? That's my aggressive bull scenario.
The chart illustrates a possible move toward the upper trendline, but that doesn't make the target guaranteed.
I want to see $PIEVERSE hold above $1.50 and continue building higher lows.
Lose that structure, and the bullish thesis starts weakening.
Because the most important part of this chart isn't the $6 target.
It's whether buyers can keep control after the initial breakout.
And right now, that's exactly what I'm watching.