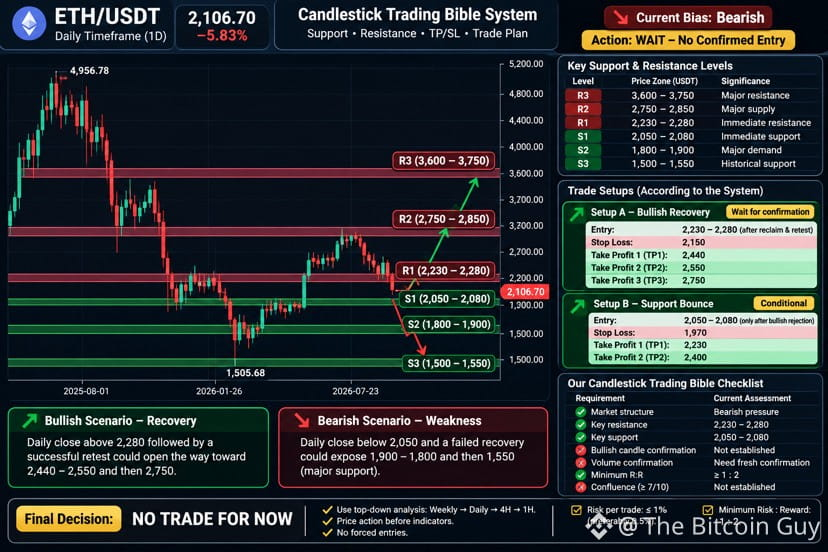
Based on my Candlestick Trading Analysis $ETH /#USDT is currently showing bearish pressure on the Daily timeframe. Price is trading below an important support-turned-resistance level.
1. Important support and resistance levels
Based on Daily chart (current price: $2,106.70):
Level Price zone Significance
R3 $3,600–3,750 Major resistance
R2 $2,750–2,850 Major supply
R1 $2,230–2,280 Immediate resistance
S1 $2,050–2,080 Immediate support
S2 $1,800–1,900 Major demand
S3 $1,500–1,550 Historical support
These are approximate technical zones, not guaranteed reversal prices.
2. Trade setup
Setup A – Bullish recovery (preferred spot setup)
Wait for confirmation
* Entry: $2,230–2,280 after reclaim and successful retest.
* Stop loss: $2,150 (illustrative; below confirmed retest swing).
* TP1: $2,440
* TP2: $2,550
* TP3: $2,750
Setup B – Support bounce
Conditional
* Entry zone: $2,050–2,080, only after bullish rejection.
* Stop loss: $1,970
* TP1: $2,230
* TP2: $2,400
Do not enter simply because price touches support.
3. What happens next?
Bullish scenario
Recovery
Daily close above $2,280 followed by a successful retest could open the way toward $2,440–2,550.
Bearish scenario
Weakness
Daily close below $2,050 and failed recovery could expose $1,900 and then $1,800.
4. Our Candlestick Trading Analysis
Requirement Current assessment
Market structure Bearish pressure
Key resistance $2,230–2,280
Support $2,050–2,080
Bullish candle confirmation Not established
Volume confirmation Need fresh chart
Minimum R:R 1:2
Confluence ≥7/10 Not established
My final decision: NO TRADE for now.
Our rules remain:
* Weekly → Daily → 4H → 1H analysis.
* Price action before indicators.
* No forced entries.
* Maximum 1% account risk, preferably 0.5%.
* Minimum 1:2 risk/reward.
1. Important support and resistance levels
Based on Daily chart (current price: $2,106.70):
Level Price zone Significance
R3 $3,600–3,750 Major resistance
R2 $2,750–2,850 Major supply
R1 $2,230–2,280 Immediate resistance
S1 $2,050–2,080 Immediate support
S2 $1,800–1,900 Major demand
S3 $1,500–1,550 Historical support
These are approximate technical zones, not guaranteed reversal prices.
2. Trade setup
Setup A – Bullish recovery (preferred spot setup)
Wait for confirmation
* Entry: $2,230–2,280 after reclaim and successful retest.
* Stop loss: $2,150 (illustrative; below confirmed retest swing).
* TP1: $2,440
* TP2: $2,550
* TP3: $2,750
Setup B – Support bounce
Conditional
* Entry zone: $2,050–2,080, only after bullish rejection.
* Stop loss: $1,970
* TP1: $2,230
* TP2: $2,400
Do not enter simply because price touches support.
3. What happens next?
Bullish scenario
Recovery
Daily close above $2,280 followed by a successful retest could open the way toward $2,440–2,550.
Bearish scenario
Weakness
Daily close below $2,050 and failed recovery could expose $1,900 and then $1,800.
4. Our Candlestick Trading Analysis
Requirement Current assessment
Market structure Bearish pressure
Key resistance $2,230–2,280
Support $2,050–2,080
Bullish candle confirmation Not established
Volume confirmation Need fresh chart
Minimum R:R 1:2
Confluence ≥7/10 Not established
My final decision: NO TRADE for now.
Our rules remain:
* Weekly → Daily → 4H → 1H analysis.
* Price action before indicators.
* No forced entries.
* Maximum 1% account risk, preferably 0.5%.
* Minimum 1:2 risk/reward.