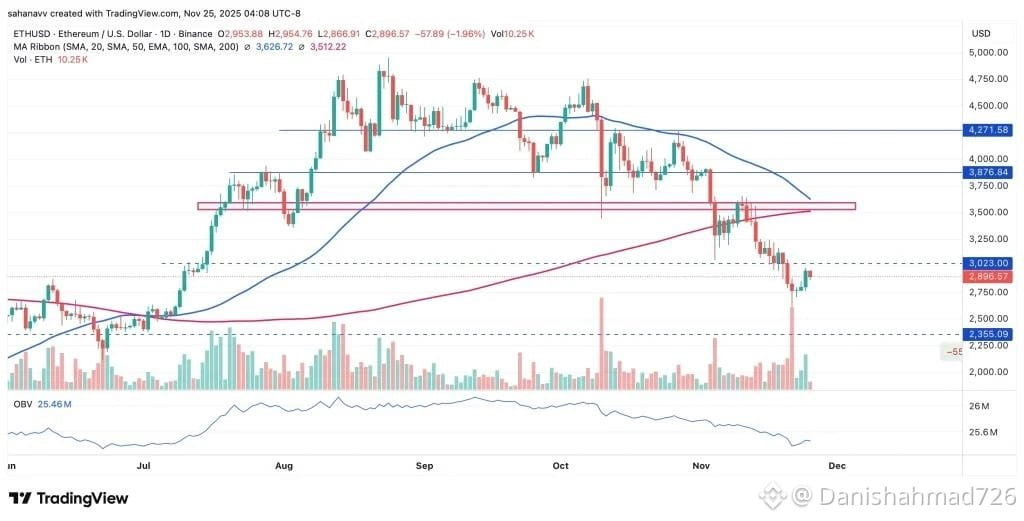
$ETH Ethereum ($ETH ) is consolidating near the $2,220 – $2,250 zone following recent market-wide corrections. The price action shows sellers maintaining dominance beneath key exponential moving averages, while buyers attempt to establish a solid demand floor.
The chart below outlines the overall structural setup for Ethereum, showing key trendlines along with major support and resistance clusters.
Technical Indicators & Price Action
Relative Strength Index (RSI): Hovering around 39 – 40 on the daily chart, pointing to weak momentum and neutral-to-oversold conditions without clear bullish divergence yet.
Moving Averages (EMA): Floating beneath the 20-day, 50-day, and 100-day EMAs clustered between $2,315 and $2,395, which act as overhead resistance capping short-term rallies.
MACD & Momentum: Negative territory with momentum slowing down, suggesting that while the broader daily trend remains cautious, a short-term consolidation phase is active.
Potential Scenarios
Bullish Breakout: A daily candle close above $2,315 confirms short-term relief momentum, opening a path toward $2,390 – $2,400. Reclaiming $2,400 with strong volume would target the next major hurdle near $2,550.
Bearish Breakdown: Losing the $2,205 support level signals renewed selling pressure, exposing lower structural floors around $2,180 and $2,107.
#ETH #Ethereum #ETHETFsApproved
The chart below outlines the overall structural setup for Ethereum, showing key trendlines along with major support and resistance clusters.
Technical Indicators & Price Action
Relative Strength Index (RSI): Hovering around 39 – 40 on the daily chart, pointing to weak momentum and neutral-to-oversold conditions without clear bullish divergence yet.
Moving Averages (EMA): Floating beneath the 20-day, 50-day, and 100-day EMAs clustered between $2,315 and $2,395, which act as overhead resistance capping short-term rallies.
MACD & Momentum: Negative territory with momentum slowing down, suggesting that while the broader daily trend remains cautious, a short-term consolidation phase is active.
Potential Scenarios
Bullish Breakout: A daily candle close above $2,315 confirms short-term relief momentum, opening a path toward $2,390 – $2,400. Reclaiming $2,400 with strong volume would target the next major hurdle near $2,550.
Bearish Breakdown: Losing the $2,205 support level signals renewed selling pressure, exposing lower structural floors around $2,180 and $2,107.
#ETH #Ethereum #ETHETFsApproved