🔥 $SOL Technical Update: Key Levels & Momentum Breakdown
📊 1. Market Snapshot
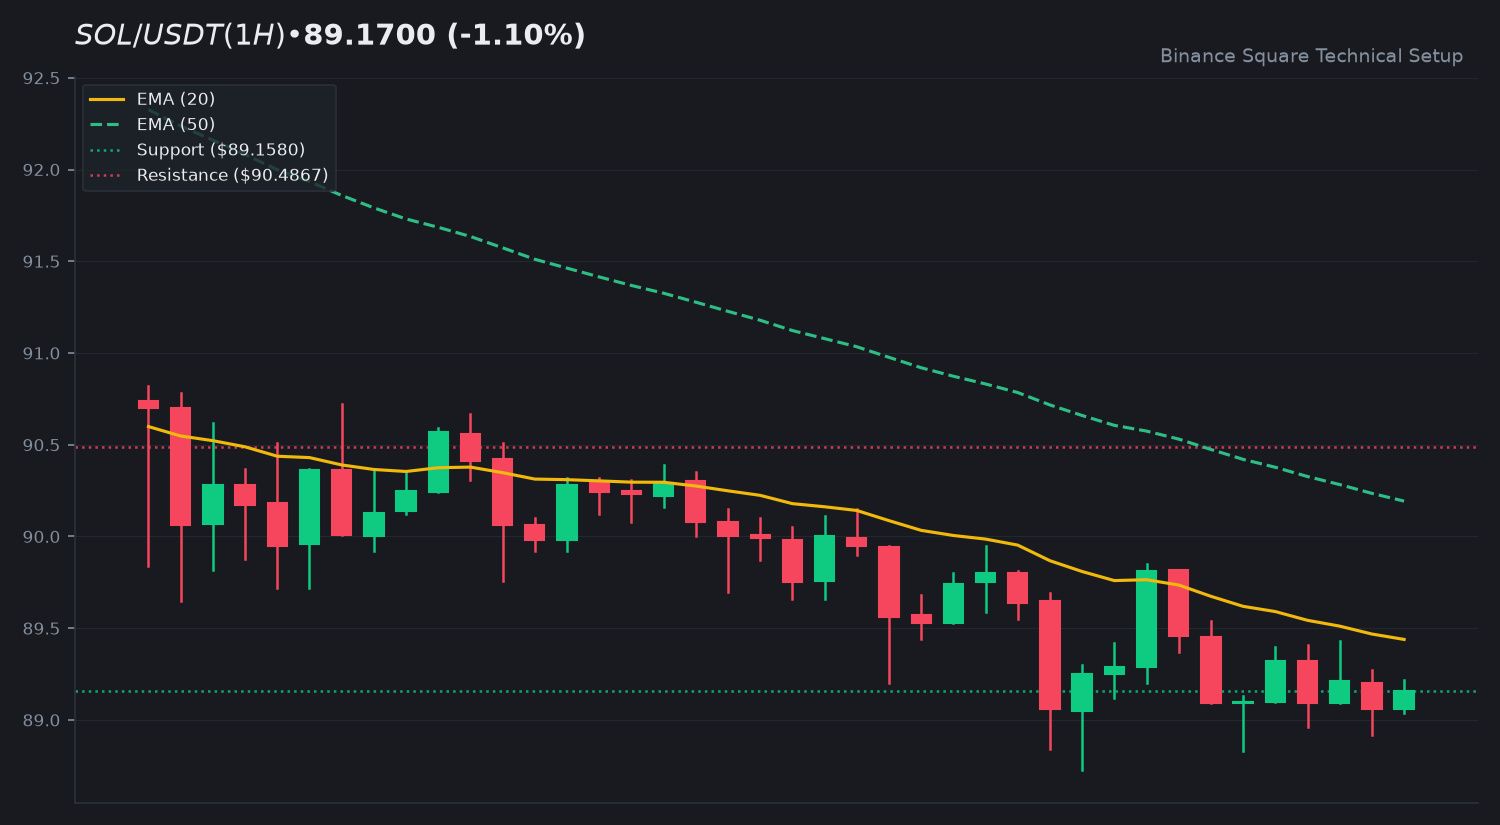
The $SOL pair is currently trading at $89.1700, reflecting a minor 24-hour decline of -1.10%. The session range spans from a daily low of $88.7300 to a high of $90.3900. Total 24-hour quote volume stands at $53,137,209 USDT, accompanied by low volume characteristics indicating a consolidation phase.
📈 2. Technical Momentum & Indicator Bias
Price action remains below the key moving averages, with the EMA 20 sitting at $89.4390 and the EMA 50 positioned at $90.1928, maintaining a strong downtrend context. The 14-period RSI prints at 42.35, reflecting a neutral-to-bearish bias without entering oversold territory. Meanwhile, the MACD histogram registers at -0.0002, with the MACD line at -0.2657 crossing slightly below the signal line at -0.2654, demonstrating subdued selling momentum on low volume conviction.
🎯 3. Key Technical Levels to Watch
• 🟢 Resistance Zone: Immediate overhead resistance is located near $90.4867, with a secondary extension target at $97.4400.
• 🔴 Support Zone: The primary support floor is established at $89.1580, aligning closely with current market valuation.
• 🛡️ Pivot Confluence: Monitoring the immediate EMA cluster for potential structural shifts.
💡 4. Technical Takeaway & Risk Management
Market participants are observing how price interacts with the immediate support floor and EMA dynamic lines. Low volume conditions suggest waiting for clear structural confirmation before determining directional continuity.
💬 5. Community Discussion
What is your technical outlook for $SOL this week? Are you accumulating or waiting for confirmation? Drop your thoughts below! 👇
⚠️ 6. Disclaimer
Educational technical analysis only. Not financial advice (NFA). Crypto markets involve risk. Always DYOR.
$SOL #SOL #BinanceSquare #CryptoAnalysis #Trading
📊 1. Market Snapshot
The $SOL pair is currently trading at $89.1700, reflecting a minor 24-hour decline of -1.10%. The session range spans from a daily low of $88.7300 to a high of $90.3900. Total 24-hour quote volume stands at $53,137,209 USDT, accompanied by low volume characteristics indicating a consolidation phase.
📈 2. Technical Momentum & Indicator Bias
Price action remains below the key moving averages, with the EMA 20 sitting at $89.4390 and the EMA 50 positioned at $90.1928, maintaining a strong downtrend context. The 14-period RSI prints at 42.35, reflecting a neutral-to-bearish bias without entering oversold territory. Meanwhile, the MACD histogram registers at -0.0002, with the MACD line at -0.2657 crossing slightly below the signal line at -0.2654, demonstrating subdued selling momentum on low volume conviction.
🎯 3. Key Technical Levels to Watch
• 🟢 Resistance Zone: Immediate overhead resistance is located near $90.4867, with a secondary extension target at $97.4400.
• 🔴 Support Zone: The primary support floor is established at $89.1580, aligning closely with current market valuation.
• 🛡️ Pivot Confluence: Monitoring the immediate EMA cluster for potential structural shifts.
💡 4. Technical Takeaway & Risk Management
Market participants are observing how price interacts with the immediate support floor and EMA dynamic lines. Low volume conditions suggest waiting for clear structural confirmation before determining directional continuity.
💬 5. Community Discussion
What is your technical outlook for $SOL this week? Are you accumulating or waiting for confirmation? Drop your thoughts below! 👇
⚠️ 6. Disclaimer
Educational technical analysis only. Not financial advice (NFA). Crypto markets involve risk. Always DYOR.
$SOL #SOL #BinanceSquare #CryptoAnalysis #Trading