

🚀 Bitcoin Price Analysis: Is the Market Crash a Trap or a Fresh Bull Run Setup? 📉🔥

Hey crypto fam! 🌟 The crypto market is always full of dramatic twists and turns, and Bitcoin ($BTC ) is leading the show once again. 📊 If we take a close look at the latest Binance 1D chart for BTC/USDT, the market is showing some intense price movements that every trader needs to watch out for! 👀💰
📈 What Does the Chart Tell Us? (Price History & Current Trends)
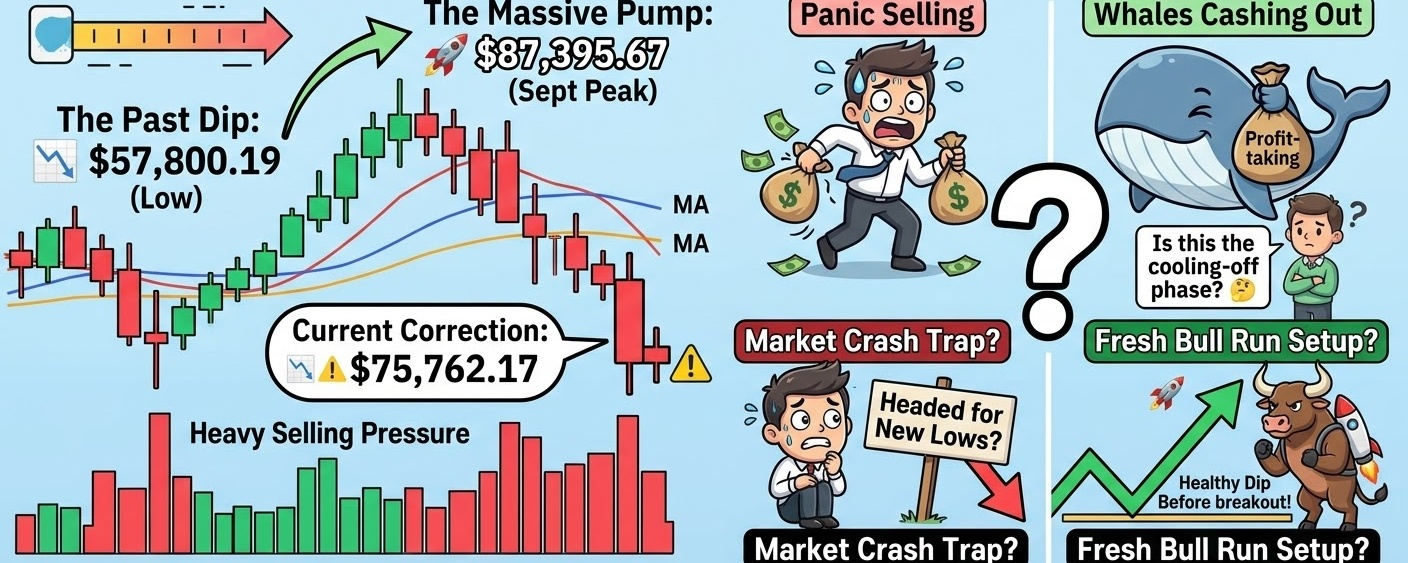
* The Past Dip: Looking back at the chart, Bitcoin faced a major downward spiral previously, dropping all the way down to a low of $57,800.19. 📉
* The Massive Pump: From that heavy dip, the market made an incredible comeback, skyrocketing to a massive peak of $87,395.67 around late September (September 29). 🚀🔥
* The Current Correction: Fast forward to right now, the charts show heavy selling pressure pushing Bitcoin down to $75,762.17. 📉⚠️
🤔 Why is the Price Dropping?
Market corrections like this usually happen due to heavy profit-taking by large investors, sudden shifts in global market sentiment, and short-term panic selling. 🌪️ Moving average (MA) lines and volume indicators suggest the market is undergoing a cooling-off phase after reaching those high September levels. 📊
💬 What do you think will happen next?
Do you think Bitcoin's price is going to crash even further down from here, or is this just a healthy dip before a massive breakout back to the top? 🚀📉
👇 Drop your predictions in the comments below and let's discuss! Don't forget to like and share! 🔥💬