🚀 $ONE USDT — Strong Bullish Momentum, But Don't Chase the Pump!
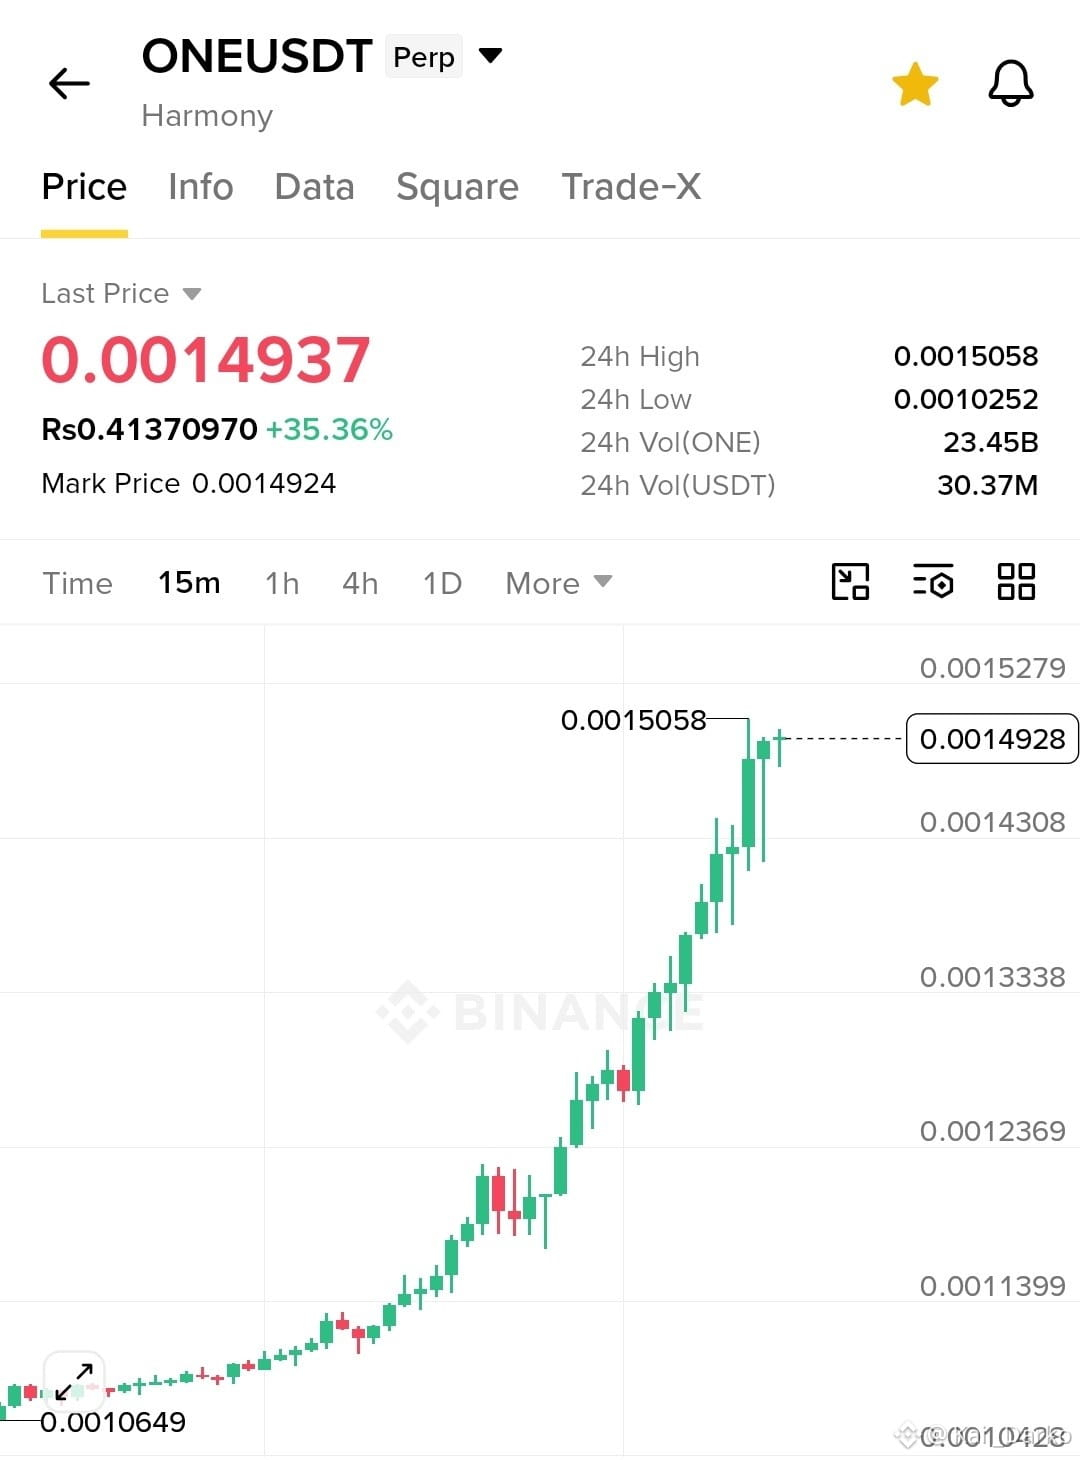
Harmony ($ONE ) is showing impressive strength on the 15-minute chart, trading around $0.0014937, up 35.36%. Price has climbed from the 24-hour low of $0.0010252 toward $0.0015058, forming a clear sequence of higher highs and higher lows. Buyers are firmly in control, but price is now testing an important resistance area.
📊 Market Structure: The $0.0014308 region is the first important support to watch. A successful retest and strong buyer reaction could create another opportunity. Below that, $0.0013338 is the next major visible support. The current resistance is the 24-hour high at $0.0015058.
⚡ Technical View: The steep upward candle structure reflects strong buying momentum. Reported 24-hour trading volume is $30.37M, showing active market participation. However, EMA, RSI, MACD, Fibonacci and candle-level volume confirmations cannot be verified from this screenshot.
🎯 Trading Plan — Bullish Setup
- Entry Zone: $0.001435–$0.001455 (on a confirmed retest)
- Stop Loss: $0.001390
- TP1: $0.0015058
- TP2: $0.0015279
- TP3: No reliable third target is visible; reassess after a confirmed breakout.
I would rather wait for a healthy pullback than chase an extended candle. A sustained break above $0.0015058 could open the door to further upside, while losing $0.0014308 would weaken the bullish setup.
Keep position size controlled and protect your capital. 📈
Are you waiting to buy the retest, or expecting ONE to break its 24-hour high? 👀
Trading involves risk; these are conditional chart-based levels, not guaranteed outcomes.#CanUSStocksReboundAfterNonfarmPayrolls? #BinanceReopensWithdrawalsForMoreAssets
Harmony ($ONE ) is showing impressive strength on the 15-minute chart, trading around $0.0014937, up 35.36%. Price has climbed from the 24-hour low of $0.0010252 toward $0.0015058, forming a clear sequence of higher highs and higher lows. Buyers are firmly in control, but price is now testing an important resistance area.
📊 Market Structure: The $0.0014308 region is the first important support to watch. A successful retest and strong buyer reaction could create another opportunity. Below that, $0.0013338 is the next major visible support. The current resistance is the 24-hour high at $0.0015058.
⚡ Technical View: The steep upward candle structure reflects strong buying momentum. Reported 24-hour trading volume is $30.37M, showing active market participation. However, EMA, RSI, MACD, Fibonacci and candle-level volume confirmations cannot be verified from this screenshot.
🎯 Trading Plan — Bullish Setup
- Entry Zone: $0.001435–$0.001455 (on a confirmed retest)
- Stop Loss: $0.001390
- TP1: $0.0015058
- TP2: $0.0015279
- TP3: No reliable third target is visible; reassess after a confirmed breakout.
I would rather wait for a healthy pullback than chase an extended candle. A sustained break above $0.0015058 could open the door to further upside, while losing $0.0014308 would weaken the bullish setup.
Keep position size controlled and protect your capital. 📈
Are you waiting to buy the retest, or expecting ONE to break its 24-hour high? 👀
Trading involves risk; these are conditional chart-based levels, not guaranteed outcomes.#CanUSStocksReboundAfterNonfarmPayrolls? #BinanceReopensWithdrawalsForMoreAssets