🚨 $AKE Massive Volatility Alert: Up 108% Today, But Look at That Chart!
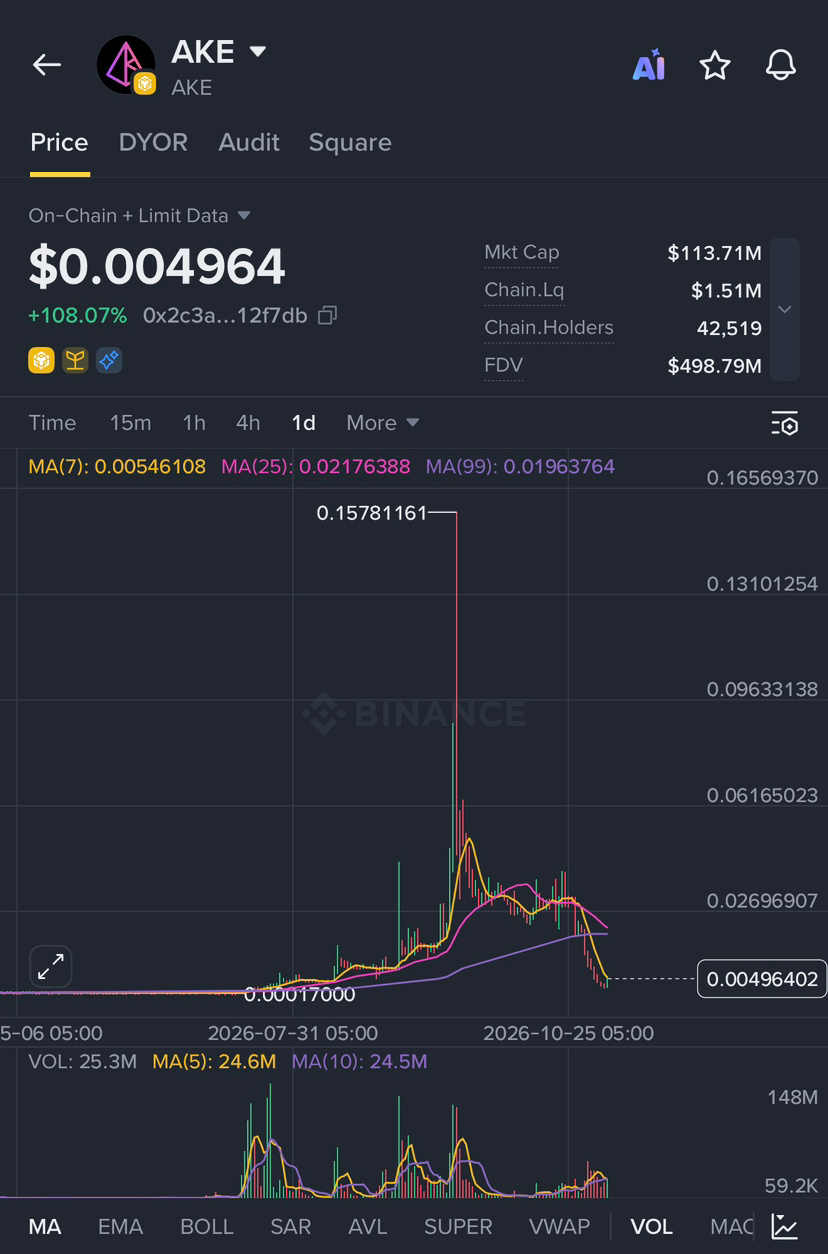
The $AKE chart is currently showing some of the most extreme volatility on the market right now. While the 24H change looks incredibly bullish, the technicals tell a very wild story. Let's break it down. 🧐👇
Current Stats:
- Price: $0.004964
- 24H Change: +108.07%
- Market Cap: $113.71M
- Liquidity: $1.51M
- Holders: 42,519
- FDV: $498.79M
Technical Analysis (1D Chart):
The Mega Wick: Look at the top of that daily candle. Price spiked massively (up to nearly 0.0049) is trading significantly below the MA(7) [0.0217] and MA(99) [$0.0196]. The short and mid-term trend is currently bearish despite today's green candle. The MAs are now acting as heavy resistance.
Volume: There was massive volume during the initial pump, but it is starting to taper off.
⚠️ Things to Watch Out For:
- FDV vs Market Cap: The Market Cap is $113M, but the FDV is nearly $500M. This is a huge gap, meaning a lot of tokens are still locked and will be released into circulation in the future. Be aware of tokenomics and inflation risks.
- Liquidity: $1.51M liquidity against a $113M market cap is quite thin. High slippage and violent price swings are highly likely.
My Verdict:
While catching a +100% move looks tempting, chasing this chart after a massive upper wick is extremely risky. The price has retraced almost entirely. If you are trading this, watch for a confirmed reclaim of the MA(7) at $0.0054 to see if the bulls have any strength left. Otherwise, it looks like it might chop sideways or test lower support levels.
Stay safe out there, manage your risk, and always set stop losses!
What are your thoughts on $AKE ? Are you buying the dip or staying away? Drop your thoughts below! 👇
Disclaimer: This is not financial advice. Always do your own research (DYOR).
#AKE #BinanceSquareTalks #DYOR
The $AKE chart is currently showing some of the most extreme volatility on the market right now. While the 24H change looks incredibly bullish, the technicals tell a very wild story. Let's break it down. 🧐👇
Current Stats:
- Price: $0.004964
- 24H Change: +108.07%
- Market Cap: $113.71M
- Liquidity: $1.51M
- Holders: 42,519
- FDV: $498.79M
Technical Analysis (1D Chart):
The Mega Wick: Look at the top of that daily candle. Price spiked massively (up to nearly 0.0049) is trading significantly below the MA(7) [0.0217] and MA(99) [$0.0196]. The short and mid-term trend is currently bearish despite today's green candle. The MAs are now acting as heavy resistance.
Volume: There was massive volume during the initial pump, but it is starting to taper off.
⚠️ Things to Watch Out For:
- FDV vs Market Cap: The Market Cap is $113M, but the FDV is nearly $500M. This is a huge gap, meaning a lot of tokens are still locked and will be released into circulation in the future. Be aware of tokenomics and inflation risks.
- Liquidity: $1.51M liquidity against a $113M market cap is quite thin. High slippage and violent price swings are highly likely.
My Verdict:
While catching a +100% move looks tempting, chasing this chart after a massive upper wick is extremely risky. The price has retraced almost entirely. If you are trading this, watch for a confirmed reclaim of the MA(7) at $0.0054 to see if the bulls have any strength left. Otherwise, it looks like it might chop sideways or test lower support levels.
Stay safe out there, manage your risk, and always set stop losses!
What are your thoughts on $AKE ? Are you buying the dip or staying away? Drop your thoughts below! 👇
Disclaimer: This is not financial advice. Always do your own research (DYOR).
#AKE #BinanceSquareTalks #DYOR