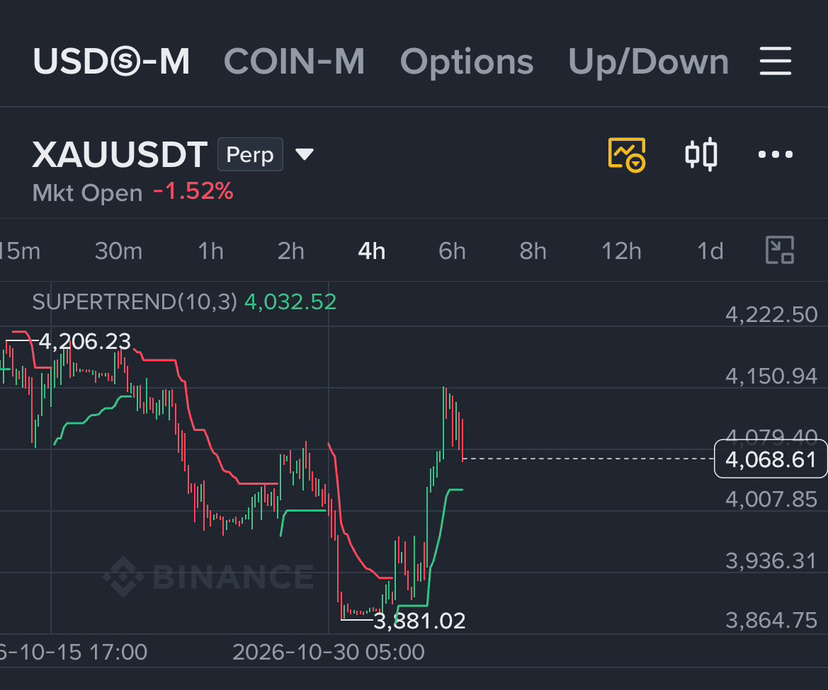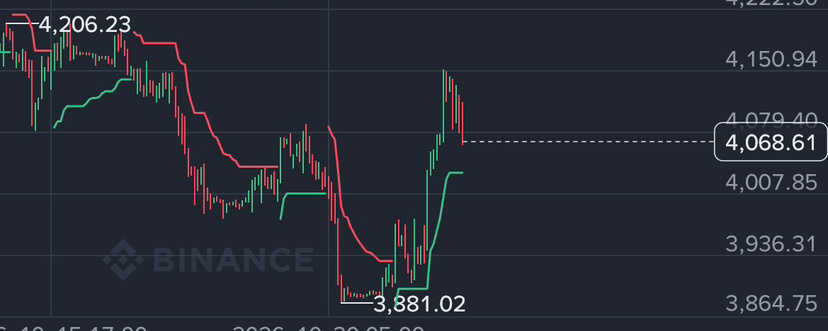

I have analyzed your Binance screenshot. It shows XAUUSDT Perpetual Futures on the 4-hour timeframe (4H).
Short-term recovery visible
1. Chart analysis
4,068.61 USDT
Price shown in your screenshot, not a live quote
Here is what the chart indicates:
Previous high: 4,206.23
Recent low: 3,881.02
Current price: 4,068.61
Supertrend: 4,032.52 (green)
Gold experienced a significant decline, found support around 3,881, and then recovered strongly.
However, the latest candles show some rejection after the move towards 4,150. This suggests that buyers and sellers are currently competing.
2. Important technical levels
Level
Price
Significance
Resistance 2
4,150
Strong resistance area
Resistance 1
4,079
Nearby resistance
Current price
4,068.61
Current chart price
Support 1
4,032
Supertrend support
Support 2
4,008
Further support
Support 3
3,936
Lower support
Major low
3,881
Previous swing low
Important: A move above resistance or below support needs candle confirmation. These levels are estimates from your screenshot, not guaranteed turning points.
3. Latest gold market updates – November 6, 2026
The latest reports indicate a strong recovery in gold after its recent sell-off.
Bullish recovery
Latest reported market developments
Important market developments:
US dollar weakness: The dollar weakened following US midterm election results, supporting gold prices.
Treasury yields: Lower US Treasury yields helped gold recover.
Central bank demand: Central banks purchased approximately 321 tonnes of gold in Q3 2026, according to the World Gold Council.
ETF demand: Gold ETF holdings also reached a reported record of 4,256 tonnes.
US employment data: The October US Non-Farm Payrolls report is a key event for November 6. Its results could influence gold through changes in interest-rate expectations. Reuters +3
4. What could happen next?
There are two important scenarios to understand:
Bullish scenario
Gold holds above the 4,032–4,008 support area shown in your chart.
It recovers above 4,079.
The 4,150 resistance becomes important.
A sustained move above 4,150 could indicate further recovery.
Recovery scenario
Bearish scenario
Gold loses the 4,032 support area.
Price moves below 4,008.
The next areas to watch are 3,936 and 3,881.
Downside risk
5. My overall assessment
The broader market has shown signs of recovery, supported by a weaker dollar and lower bond yields. However, the recovery is not yet proof that the previous downtrend has ended.
The most important upcoming event is US employment data. Also, remember that the screenshot shows a historical chart snapshot, not today’s live market.
Risk note: Your screenshot displays 20x leverage on perpetual futures. That can magnify losses as well as gains, so these levels are for educational chart analysis, not instructions to open a position.
6. Latest news sources
Reuters – Gold rises as dollar and yields weaken
FXEmpire – Gold technical forecast
World Gold Council – Gold market commentary
Wall Street Journal – Gold market update, November 6
I can also analyze your next XAUUSDT screenshot and explain the 15-minute, 1-hour and 4-hour chart trends in English.
#BinanceReopensWithdrawalsForMoreAssets #USStocksSlipandCryptoMarketUnderBroadPressure $XAU