📉 $SQQQB Jumps 21.66% — Is Nasdaq Facing Another Wave of Selling? ⚡
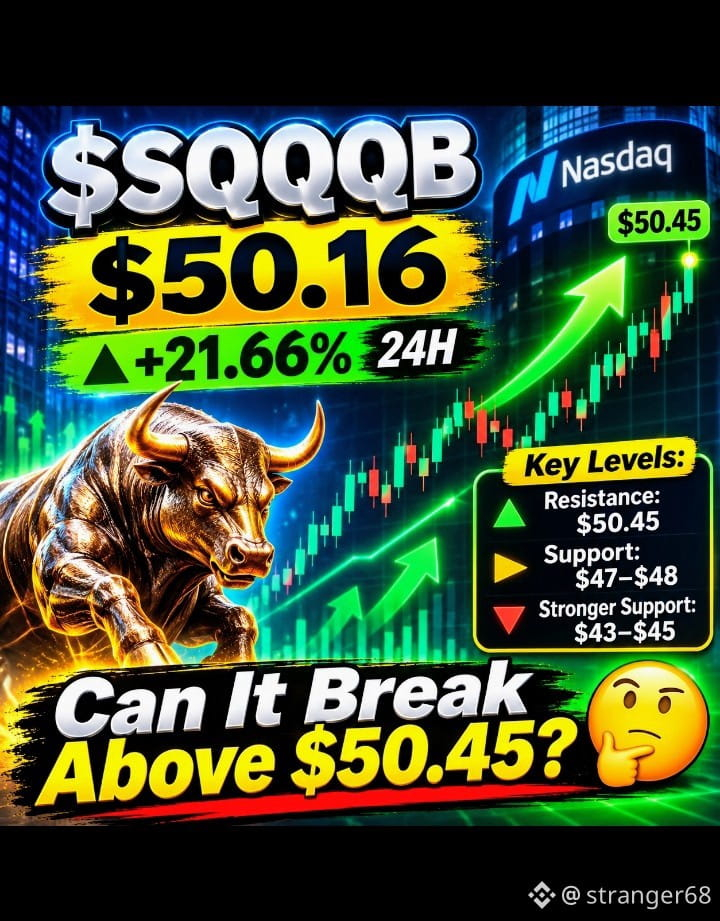
🔥 A powerful move has lifted SQQQB to $50.16, up 21.66% in 24 hours, with price reaching $50.45 after climbing from $41.23. The sharp breakout suggests strong demand for downside Nasdaq exposure, but can this momentum continue? 🚀
⚡ 1H Chart: Price is trading above all three moving averages: MA(7) at $48.77, MA(25) at $44.33, and MA(99) at $42.79. Short-term momentum remains strong, although a pause near the $50.45 high would not be surprising. 📊
📈 4H Chart: The breakout is becoming more significant, with price well above MA(7) at $45.15, MA(25) at $43.11, and MA(99) at $40.03. Holding the $47–$48 region could help maintain the current upward structure. 🔥
🌍 1D Chart: The broader recovery is impressive, with price moving above MA(7) at $43.05 and MA(25) at $39.34. The latest surge signals strong momentum, but volatility could increase after such a rapid advance. 🛡️
🎯 Important Levels:
- Resistance: $50.45
- Immediate support: $47–$48
- Stronger support: $43–$45
⚠️ Remember, this is a leveraged inverse Nasdaq ETF, so sharp moves can bring equally sharp reversals.
💬 Can the price break above $50.45 and extend the rally, or is a pullback approaching? What's your take? 🔥
#SQQQB #Nasdaq #CryptoAndStocks
#BinanceReopensWithdrawalsForMoreAssets #USMidterms-WhatAreMarketsExpecting? #Binance98PercentReplenished #ADPUSPrivateEmployersAdd86000JobsInOctober
🔥 A powerful move has lifted SQQQB to $50.16, up 21.66% in 24 hours, with price reaching $50.45 after climbing from $41.23. The sharp breakout suggests strong demand for downside Nasdaq exposure, but can this momentum continue? 🚀
⚡ 1H Chart: Price is trading above all three moving averages: MA(7) at $48.77, MA(25) at $44.33, and MA(99) at $42.79. Short-term momentum remains strong, although a pause near the $50.45 high would not be surprising. 📊
📈 4H Chart: The breakout is becoming more significant, with price well above MA(7) at $45.15, MA(25) at $43.11, and MA(99) at $40.03. Holding the $47–$48 region could help maintain the current upward structure. 🔥
🌍 1D Chart: The broader recovery is impressive, with price moving above MA(7) at $43.05 and MA(25) at $39.34. The latest surge signals strong momentum, but volatility could increase after such a rapid advance. 🛡️
🎯 Important Levels:
- Resistance: $50.45
- Immediate support: $47–$48
- Stronger support: $43–$45
⚠️ Remember, this is a leveraged inverse Nasdaq ETF, so sharp moves can bring equally sharp reversals.
💬 Can the price break above $50.45 and extend the rally, or is a pullback approaching? What's your take? 🔥
#SQQQB #Nasdaq #CryptoAndStocks
#BinanceReopensWithdrawalsForMoreAssets #USMidterms-WhatAreMarketsExpecting? #Binance98PercentReplenished #ADPUSPrivateEmployersAdd86000JobsInOctober