
P2P USDTRAND
123 Публикации
P2P USDTRAND
Отправить жалобу
Заблокировать пользователя
Открытая сделка
Трейдер с регулярными сделками
3.7 г
135 подписок(и/а)
93 подписчиков(а)
47 понравилось
Посты
Портфель
Все
Цитирования
PINNED
·
--
Рост
🚨Litecoin ($LTC ) on the move🚀 to $70
From $49.59 to $62.59.
Join me now or wait until you regret
🚨Litecoin ($LTC ) on the move🚀 to $70
From $49.59 to $62.59.
Join me now or wait until you regret
From $49.59 to $62.59.
Join me now or wait until you regret
2
31
PINNED
·
--
Рост
Which one of this coin will you put your last $10 into and why ? $JCT or $ZEC or $PEPE
Which one of this coin will you put your last $10 into and why ? $JCT or $ZEC or $PEPE
JCT
ZEC
PEPE
5 дн. осталось
2
4.4k
·
--
Рост
Хранение $LTC 1 USDT
🚀 Litecoin ($LTC ) Coiling At $53.65 — Breakout Loading? 💎
{spot}(LTCUSDT)
Litecoin is holding strong in a prime accumulation zone near $53.65. With over 92% of its hard-capped 84M supply already mined and its 14-day RSI flashing deep value near 37.5, smart money is watching closely for a sharp bounce.
🗺️ Key Levels
• 🛡️ Support ($50.00): Crucial psychological floor actively defended by spot buyers.
• ⚡ Resistance ($62.00): Immediate ceiling; a daily close above triggers short liquidations.
• 🚀 Target ($70.00+): Clearing $62 opens a clean runway for a macro trend reversal.
💡 Game Plan
Gradual DCA inside the $50–$54 demand zone offers a clean risk-to-reward profile, while breakout traders should wait for a confirmed close above $62.
Are you buying $LTC now or waiting for $62? Drop your move below! 👇
#Litecoin #LTC #Crypto #Altcoins #BinanceSquare
🚀 Litecoin ($LTC ) Coiling At $53.65 — Breakout Loading? 💎
Litecoin is holding strong in a prime accumulation zone near $53.65. With over 92% of its hard-capped 84M supply already mined and its 14-day RSI flashing deep value near 37.5, smart money is watching closely for a sharp bounce.
🗺️ Key Levels
• 🛡️ Support ($50.00): Crucial psychological floor actively defended by spot buyers.
• ⚡ Resistance ($62.00): Immediate ceiling; a daily close above triggers short liquidations.
• 🚀 Target ($70.00+): Clearing $62 opens a clean runway for a macro trend reversal.
💡 Game Plan
Gradual DCA inside the $50–$54 demand zone offers a clean risk-to-reward profile, while breakout traders should wait for a confirmed close above $62.
Are you buying $LTC now or waiting for $62? Drop your move below! 👇
#Litecoin #LTC #Crypto #Altcoins #BinanceSquare
Litecoin is holding strong in a prime accumulation zone near $53.65. With over 92% of its hard-capped 84M supply already mined and its 14-day RSI flashing deep value near 37.5, smart money is watching closely for a sharp bounce.
🗺️ Key Levels
• 🛡️ Support ($50.00): Crucial psychological floor actively defended by spot buyers.
• ⚡ Resistance ($62.00): Immediate ceiling; a daily close above triggers short liquidations.
• 🚀 Target ($70.00+): Clearing $62 opens a clean runway for a macro trend reversal.
💡 Game Plan
Gradual DCA inside the $50–$54 demand zone offers a clean risk-to-reward profile, while breakout traders should wait for a confirmed close above $62.
Are you buying $LTC now or waiting for $62? Drop your move below! 👇
#Litecoin #LTC #Crypto #Altcoins #BinanceSquare
1
1
21
·
--
Падение
🚨 Janction ($JCT) Pulls Back After Massive 150%+ Rally — Prime Dip-Buying Zone Or Deeper Reset? 💎
{future}(JCTUSDT)
While the broader market moves cautiously, Janction ($JCT) has been one of the wildest high-volume movers on the board this week. After exploding over 150%+ to hit a fresh all-time high near $0.0180 on November 8, 2026, $JCT underwent a sharp post-unlock pullback—now stabilizing around $0.0052–$0.0061 with massive 24-hour trading volume exceeding $80M–$125M+ across spot and futures markets.
With heavy liquidity on Binance Alpha and Binance Futures (JCTUSDT), smart money is watching closely to see where this decentralized AI compute play sets its next higher low.
🔍 The Technical & Market Setup
• Healthy Post-Spike Reset: Earlier this week, a $10.4M token unlock triggered profit-taking right after $JCT's parabolic run. Despite the sharp retrace from $0.0180, $JCT is still holding strong multi-week gains—up nearly +200% over the past 30 days.
• Tokenomics & Liquidity: With roughly 11.5B–12.78B JCT in circulation out of a 50 billion maximum supply, its market cap sits around $56M–$63M. Massive futures volume (over $440M on Binance Futures alone) shows intense trader interest.
🗺️ Key Price Levels to Watch
• 🛡️ The Crucial Floor ($0.0042–$0.0050): Buyers have been actively absorbing dips around the $0.0050–$0.0051 zone, with deeper structural support resting near $0.0042–$0.0043. Holding above this demand band keeps the broader uptrend intact.
• ⚡ Immediate Hurdle ($0.0065–$0.0072): Reclaiming and closing a 4H candle above local resistance around $0.0062–$0.0072 is the first trigger needed to flip short-term momentum back to bullish.
• 🚀 Breakout Target ($0.0120+): Clearing $0.0072 opens a wide technical runway toward $0.0120 and a potential retest of the $0.0180 highs.
Are you buying this post-unlock dip on $JCT or waiting for a confirmed reclaim of $0.0065? Drop your targets below! 👇
#JCT #Janction #AI #DePIN #BinaneSquare
🚨 Janction ($JCT) Pulls Back After Massive 150%+ Rally — Prime Dip-Buying Zone Or Deeper Reset? 💎
While the broader market moves cautiously, Janction ($JCT) has been one of the wildest high-volume movers on the board this week. After exploding over 150%+ to hit a fresh all-time high near $0.0180 on November 8, 2026, $JCT underwent a sharp post-unlock pullback—now stabilizing around $0.0052–$0.0061 with massive 24-hour trading volume exceeding $80M–$125M+ across spot and futures markets.
With heavy liquidity on Binance Alpha and Binance Futures (JCTUSDT), smart money is watching closely to see where this decentralized AI compute play sets its next higher low.
🔍 The Technical & Market Setup
• Healthy Post-Spike Reset: Earlier this week, a $10.4M token unlock triggered profit-taking right after $JCT's parabolic run. Despite the sharp retrace from $0.0180, $JCT is still holding strong multi-week gains—up nearly +200% over the past 30 days.
• Tokenomics & Liquidity: With roughly 11.5B–12.78B JCT in circulation out of a 50 billion maximum supply, its market cap sits around $56M–$63M. Massive futures volume (over $440M on Binance Futures alone) shows intense trader interest.
🗺️ Key Price Levels to Watch
• 🛡️ The Crucial Floor ($0.0042–$0.0050): Buyers have been actively absorbing dips around the $0.0050–$0.0051 zone, with deeper structural support resting near $0.0042–$0.0043. Holding above this demand band keeps the broader uptrend intact.
• ⚡ Immediate Hurdle ($0.0065–$0.0072): Reclaiming and closing a 4H candle above local resistance around $0.0062–$0.0072 is the first trigger needed to flip short-term momentum back to bullish.
• 🚀 Breakout Target ($0.0120+): Clearing $0.0072 opens a wide technical runway toward $0.0120 and a potential retest of the $0.0180 highs.
Are you buying this post-unlock dip on $JCT or waiting for a confirmed reclaim of $0.0065? Drop your targets below! 👇
#JCT #Janction #AI #DePIN #BinaneSquare
While the broader market moves cautiously, Janction ($JCT) has been one of the wildest high-volume movers on the board this week. After exploding over 150%+ to hit a fresh all-time high near $0.0180 on November 8, 2026, $JCT underwent a sharp post-unlock pullback—now stabilizing around $0.0052–$0.0061 with massive 24-hour trading volume exceeding $80M–$125M+ across spot and futures markets.
With heavy liquidity on Binance Alpha and Binance Futures (JCTUSDT), smart money is watching closely to see where this decentralized AI compute play sets its next higher low.
🔍 The Technical & Market Setup
• Healthy Post-Spike Reset: Earlier this week, a $10.4M token unlock triggered profit-taking right after $JCT's parabolic run. Despite the sharp retrace from $0.0180, $JCT is still holding strong multi-week gains—up nearly +200% over the past 30 days.
• Tokenomics & Liquidity: With roughly 11.5B–12.78B JCT in circulation out of a 50 billion maximum supply, its market cap sits around $56M–$63M. Massive futures volume (over $440M on Binance Futures alone) shows intense trader interest.
🗺️ Key Price Levels to Watch
• 🛡️ The Crucial Floor ($0.0042–$0.0050): Buyers have been actively absorbing dips around the $0.0050–$0.0051 zone, with deeper structural support resting near $0.0042–$0.0043. Holding above this demand band keeps the broader uptrend intact.
• ⚡ Immediate Hurdle ($0.0065–$0.0072): Reclaiming and closing a 4H candle above local resistance around $0.0062–$0.0072 is the first trigger needed to flip short-term momentum back to bullish.
• 🚀 Breakout Target ($0.0120+): Clearing $0.0072 opens a wide technical runway toward $0.0120 and a potential retest of the $0.0180 highs.
Are you buying this post-unlock dip on $JCT or waiting for a confirmed reclaim of $0.0065? Drop your targets below! 👇
#JCT #Janction #AI #DePIN #BinaneSquare
1
346
·
--
Рост
🚀 KGeN ($KGEN ) Surging +24% Off Macro Lows — Is The Verified AI & Gaming Giant Waking Up? 💎
{future}(KGENUSDT)
While many mid-cap altcoins are stuck moving sideways, KGeN just flashed a massive wake-up call to the market. After carving out a rock-solid bottom near $0.060 earlier this week, $KGEN has exploded +24% over the past 24 hours to trade around $0.083, backed by a massive spike in daily trading volume exceeding $20.8 million. [1, 2]
Are you riding this $KGEN breakout wave or waiting for a pullback to load your bags? Drop your targets below! 👇
#KGEN #AI #Web3Gaming #Altcoins
#CryptoAnalysis #BinanceSquare
🚀 KGeN ($KGEN ) Surging +24% Off Macro Lows — Is The Verified AI & Gaming Giant Waking Up? 💎
While many mid-cap altcoins are stuck moving sideways, KGeN just flashed a massive wake-up call to the market. After carving out a rock-solid bottom near $0.060 earlier this week, $KGEN has exploded +24% over the past 24 hours to trade around $0.083, backed by a massive spike in daily trading volume exceeding $20.8 million. [1, 2]
Are you riding this $KGEN breakout wave or waiting for a pullback to load your bags? Drop your targets below! 👇
#KGEN #AI #Web3Gaming #Altcoins
#CryptoAnalysis #BinanceSquare
While many mid-cap altcoins are stuck moving sideways, KGeN just flashed a massive wake-up call to the market. After carving out a rock-solid bottom near $0.060 earlier this week, $KGEN has exploded +24% over the past 24 hours to trade around $0.083, backed by a massive spike in daily trading volume exceeding $20.8 million. [1, 2]
Are you riding this $KGEN breakout wave or waiting for a pullback to load your bags? Drop your targets below! 👇
#KGEN #AI #Web3Gaming #Altcoins
#CryptoAnalysis #BinanceSquare
1
208
·
--
Рост
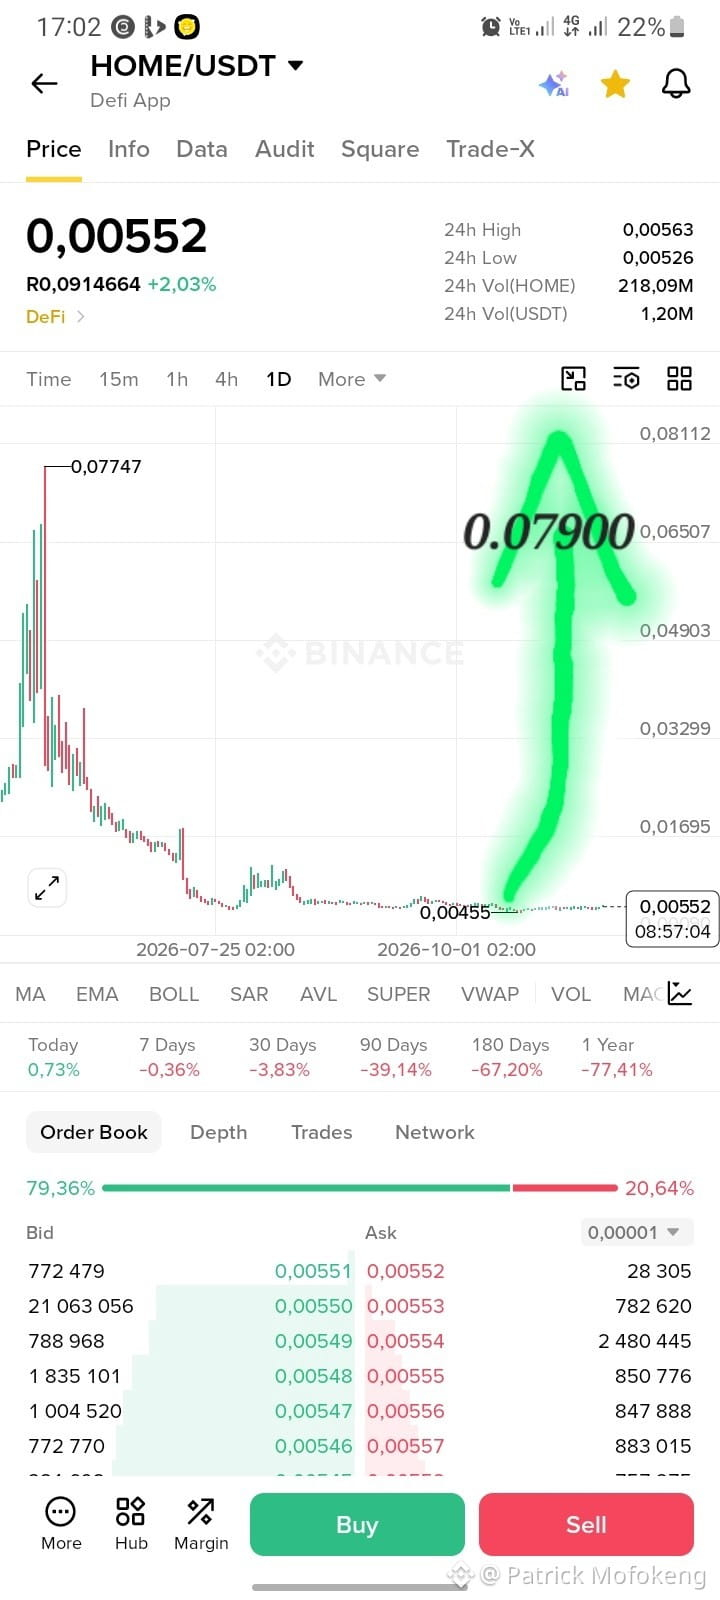
🚀 Defi App ($HOME ) Holding Firm At $0.00549 — Is A Major Reversal Loading? 💎
While the broader altcoin market consolidates, Defi App ($HOME) is quietly carving out a textbook bottom right around $0.00549. Currently trading more than 92% below its June 2026 all-time high of $0.07476, $HOME has repeatedly tested and defended its structural floor—making it a top low-cap setup on smartmoney watchlists.
🔍 The Technical & Market Setup
Current Snapshot: Trading near $0.00549 with a market cap of roughly $23.97 million and nearly $5.0 million in 24-hour trading volume across major exchanges.
Supply Dynamics: Roughly 4.37 billion HOME are currently in circulation out of a 10 billion maximum supply, giving the project a fully diluted valuation (FDV) around $54.9 million.
Momentum Check: Over the past 7 days, HOME has shown relative strength by holding green while several peer tokens pulled back, signaling steady spot accumulation near the lows.
🗺️ Key Price Levels to Watch
🛡️ The Hard Floor ($0.00456–$0.00500): HOME established its all-time low near $0.00456 in October 2026 and has since built firm support between $0.00500 and $0.00538.
⚡ Immediate Hurdle ($0.00560–$0.00562): A clean breakout and 4H close above the top of its recent daily range ($0.00559–$0.00562) is the first trigger needed to ignite short-term momentum.
🚀 Breakout Target ($0.00800+): Clearing local resistance opens a clear technical runway toward the $0.00800 psychological zone as liquidity rotates back into DeFi infrastructure plays.
💡 Why HOME Has Fundamental Backing
Spot Strategy: Gradual DCA entries inside the $0.00500–$0.00550 accumulation band offer an asymmetric risk-to-reward profile near macro lows.
Breakout Strategy: Wait for a confirmed daily close above $0.00562 backed by rising volume before sizing into momentum trades.
Are you accumulating $HOME at these deep discount levels or waiting for a confirmed breakout above $0.0056? Drop your trading plan below! 👇
#Home #DeFiApp #altcoins #CryptoAnalysis #binancesquare
{spot}(HOMEUSDT)
🚀 Defi App ($HOME ) Holding Firm At $0.00549 — Is A Major Reversal Loading? 💎
While the broader altcoin market consolidates, Defi App ($HOME ) is quietly carving out a textbook bottom right around $0.00549. Currently trading more than 92% below its June 2026 all-time high of $0.07476, $HOME has repeatedly tested and defended its structural floor—making it a top low-cap setup on smartmoney watchlists.
🔍 The Technical & Market Setup
Current Snapshot: Trading near $0.00549 with a market cap of roughly $23.97 million and nearly $5.0 million in 24-hour trading volume across major exchanges.
Supply Dynamics: Roughly 4.37 billion HOME are currently in circulation out of a 10 billion maximum supply, giving the project a fully diluted valuation (FDV) around $54.9 million.
Momentum Check: Over the past 7 days, HOME has shown relative strength by holding green while several peer tokens pulled back, signaling steady spot accumulation near the lows.
🗺️ Key Price Levels to Watch
🛡️ The Hard Floor ($0.00456–$0.00500): HOME established its all-time low near $0.00456 in October 2026 and has since built firm support between $0.00500 and $0.00538.
⚡ Immediate Hurdle ($0.00560–$0.00562): A clean breakout and 4H close above the top of its recent daily range ($0.00559–$0.00562) is the first trigger needed to ignite short-term momentum.
🚀 Breakout Target ($0.00800+): Clearing local resistance opens a clear technical runway toward the $0.00800 psychological zone as liquidity rotates back into DeFi infrastructure plays.
💡 Why HOME Has Fundamental Backing
Spot Strategy: Gradual DCA entries inside the $0.00500–$0.00550 accumulation band offer an asymmetric risk-to-reward profile near macro lows.
Breakout Strategy: Wait for a confirmed daily close above $0.00562 backed by rising volume before sizing into momentum trades.
Are you accumulating $HOME at these deep discount levels or waiting for a confirmed breakout above $0.0056? Drop your trading plan below! 👇
#Home #DeFiApp #altcoins #CryptoAnalysis #binancesquare
While the broader altcoin market consolidates, Defi App ($HOME ) is quietly carving out a textbook bottom right around $0.00549. Currently trading more than 92% below its June 2026 all-time high of $0.07476, $HOME has repeatedly tested and defended its structural floor—making it a top low-cap setup on smartmoney watchlists.
🔍 The Technical & Market Setup
Current Snapshot: Trading near $0.00549 with a market cap of roughly $23.97 million and nearly $5.0 million in 24-hour trading volume across major exchanges.
Supply Dynamics: Roughly 4.37 billion HOME are currently in circulation out of a 10 billion maximum supply, giving the project a fully diluted valuation (FDV) around $54.9 million.
Momentum Check: Over the past 7 days, HOME has shown relative strength by holding green while several peer tokens pulled back, signaling steady spot accumulation near the lows.
🗺️ Key Price Levels to Watch
🛡️ The Hard Floor ($0.00456–$0.00500): HOME established its all-time low near $0.00456 in October 2026 and has since built firm support between $0.00500 and $0.00538.
⚡ Immediate Hurdle ($0.00560–$0.00562): A clean breakout and 4H close above the top of its recent daily range ($0.00559–$0.00562) is the first trigger needed to ignite short-term momentum.
🚀 Breakout Target ($0.00800+): Clearing local resistance opens a clear technical runway toward the $0.00800 psychological zone as liquidity rotates back into DeFi infrastructure plays.
💡 Why HOME Has Fundamental Backing
Spot Strategy: Gradual DCA entries inside the $0.00500–$0.00550 accumulation band offer an asymmetric risk-to-reward profile near macro lows.
Breakout Strategy: Wait for a confirmed daily close above $0.00562 backed by rising volume before sizing into momentum trades.
Are you accumulating $HOME at these deep discount levels or waiting for a confirmed breakout above $0.0056? Drop your trading plan below! 👇
#Home #DeFiApp #altcoins #CryptoAnalysis #binancesquare
1
251
·
--
Рост
Claim free $ONE
Comment
Follow
Like
Share
{spot}(ONEUSDT)
Claim free $ONE
Comment
Follow
Like
Share
Comment
Follow
Like
Share

Life is Race
·
--
$ONE Claim A Big Gift here 🎁🎁🎁🎁🎁🎁🧧🧧🧧🧧🧧🧧✅✅✅✅✅✅
4


·
--

10
·
--
Free $USTC
{future}(USTCUSDT)
Free $USTC


E L E X A
·
--
🚨 IT’S LIVE 🚨
Watching is simple… but winners take action 👀
🎁 Want FREE $USDT?
💬 Comment 888
❤️ Like
🔁 Share
➕ Follow
#Crypto #USDT #Giveaway
Watching is simple… but winners take action 👀
🎁 Want FREE $USDT?
💬 Comment 888
❤️ Like
🔁 Share
➕ Follow
#Crypto #USDT #Giveaway

1
·
--
Рост
🚨 Anthropic’s Historic $1.4 Trillion IPO Is Here! Why Crypto & AI Traders Are Watching Closely 🚀
Traditional finance and AI are colliding in the biggest public debut in market history. Anthropic—the creator of Claude—has officially launched its IPO roadshow, targeting a massive $1.4 trillion valuation on the Nasdaq under the ticker $ANT around November 19, 2026.
With $90B–$100B in total capital on the line, this listing is a massive liquidity event that will set the tone for both tech stocks and AI-focused crypto narratives.
🔍 The IPO Breakdown
• Price Range & Ticker: Expected to price between $70 and $78 per share on the Nasdaq (ANT), offering 825 million shares to raise up to $64.35 billion publicly.
• Tech Giants Backing It: Seven industry heavyweights—Nvidia, Google, Microsoft, AMD, Broadcom, Micron, and TSMC—are pouring $26 billion into a concurrent private placement at the IPO price.
• Explosive Growth: Anthropic reported $33.2 billion in revenue for the first nine months of 2026 (up over 1,200% YoY) and hit an $81 billion annualized revenue run rate by October.
🗺️ Key Dates & Market Catalysts
• 📅 November 17: Retail subscription window closes (20% of shares are reserved for retail investors via major brokerages).
• 📅 November 18: Final IPO share price is locked in after market close.
• 📅 November 19–20: Official trading begins on the Nasdaq—expect extreme market-wide volatility.
💡 Why This Matters for Crypto Traders
• Liquidity Rotation: A $100B capital raise can temporarily pull liquidity from risk-on markets as institutions rebalance portfolios ahead of the listing.
• The AI Narrative: A strong debut above the $78 target price could spark a massive sympathy rally across decentralized AI, compute, and data tokens. Conversely, a weak opening could cool off high-beta AI plays in the short term.
How do you think Anthropic’s $1.4T debut will impact AI tokens and the broader market next week? Drop your take below! 👇
#Anthropic #IPO #AI #CryptoNews
{future}(ANTHROPICUSDT)
#StockMarket #AnthropicIPO
🚨 Anthropic’s Historic $1.4 Trillion IPO Is Here! Why Crypto & AI Traders Are Watching Closely 🚀
Traditional finance and AI are colliding in the biggest public debut in market history. Anthropic—the creator of Claude—has officially launched its IPO roadshow, targeting a massive $1.4 trillion valuation on the Nasdaq under the ticker $ANT around November 19, 2026.
With $90B–$100B in total capital on the line, this listing is a massive liquidity event that will set the tone for both tech stocks and AI-focused crypto narratives.
🔍 The IPO Breakdown
• Price Range & Ticker: Expected to price between $70 and $78 per share on the Nasdaq (ANT), offering 825 million shares to raise up to $64.35 billion publicly.
• Tech Giants Backing It: Seven industry heavyweights—Nvidia, Google, Microsoft, AMD, Broadcom, Micron, and TSMC—are pouring $26 billion into a concurrent private placement at the IPO price.
• Explosive Growth: Anthropic reported $33.2 billion in revenue for the first nine months of 2026 (up over 1,200% YoY) and hit an $81 billion annualized revenue run rate by October.
🗺️ Key Dates & Market Catalysts
• 📅 November 17: Retail subscription window closes (20% of shares are reserved for retail investors via major brokerages).
• 📅 November 18: Final IPO share price is locked in after market close.
• 📅 November 19–20: Official trading begins on the Nasdaq—expect extreme market-wide volatility.
💡 Why This Matters for Crypto Traders
• Liquidity Rotation: A $100B capital raise can temporarily pull liquidity from risk-on markets as institutions rebalance portfolios ahead of the listing.
• The AI Narrative: A strong debut above the $78 target price could spark a massive sympathy rally across decentralized AI, compute, and data tokens. Conversely, a weak opening could cool off high-beta AI plays in the short term.
How do you think Anthropic’s $1.4T debut will impact AI tokens and the broader market next week? Drop your take below! 👇
#Anthropic #IPO #AI #CryptoNews
#StockMarket #AnthropicIPO
Traditional finance and AI are colliding in the biggest public debut in market history. Anthropic—the creator of Claude—has officially launched its IPO roadshow, targeting a massive $1.4 trillion valuation on the Nasdaq under the ticker $ANT around November 19, 2026.
With $90B–$100B in total capital on the line, this listing is a massive liquidity event that will set the tone for both tech stocks and AI-focused crypto narratives.
🔍 The IPO Breakdown
• Price Range & Ticker: Expected to price between $70 and $78 per share on the Nasdaq (ANT), offering 825 million shares to raise up to $64.35 billion publicly.
• Tech Giants Backing It: Seven industry heavyweights—Nvidia, Google, Microsoft, AMD, Broadcom, Micron, and TSMC—are pouring $26 billion into a concurrent private placement at the IPO price.
• Explosive Growth: Anthropic reported $33.2 billion in revenue for the first nine months of 2026 (up over 1,200% YoY) and hit an $81 billion annualized revenue run rate by October.
🗺️ Key Dates & Market Catalysts
• 📅 November 17: Retail subscription window closes (20% of shares are reserved for retail investors via major brokerages).
• 📅 November 18: Final IPO share price is locked in after market close.
• 📅 November 19–20: Official trading begins on the Nasdaq—expect extreme market-wide volatility.
💡 Why This Matters for Crypto Traders
• Liquidity Rotation: A $100B capital raise can temporarily pull liquidity from risk-on markets as institutions rebalance portfolios ahead of the listing.
• The AI Narrative: A strong debut above the $78 target price could spark a massive sympathy rally across decentralized AI, compute, and data tokens. Conversely, a weak opening could cool off high-beta AI plays in the short term.
How do you think Anthropic’s $1.4T debut will impact AI tokens and the broader market next week? Drop your take below! 👇
#Anthropic #IPO #AI #CryptoNews
#StockMarket #AnthropicIPO
1
1
280
·
--
Рост
{spot}(BTCUSDT)
#
🚨 Bitcoin ($BTC ) Holding The Line At $73,800
While short-term panic shakes out weak hands, Bitcoin ($BTC) is testing one of the most important macro support zones on the entire chart around $73,500–$73,900.
Here is the exact breakdown of what is happening on the $BTC chart right now!
🔍 The Technical Setup
• Testing Major Macro Support: After losing the psychological $80,000 handle earlier this month, BTC pulled back into the $73,000–$73,800 demand zone—a critical confluence area combining the 200-day moving average and the 20-week simple moving average.
• Momentum Reset: The daily RSI has cooled off below the 50 neutral line, wiping out overheated long leverage and resetting the market for a healthier, more sustainable move.
🗺️ Key Price Levels to Watch
• 🛡️ The Ultimate Floor ($73,000–$73,500): This is the line in the sand for bulls. Defending this zone keeps the broader multi-month bullish structure intact. A clean breakdown below $73,000 exposes the major psychological $70,000 support next.
• ⚡ Immediate Hurdle ($76,800–$78,000): Reclaiming the 21-week EMA near $76,875 is the first signal that buyers are stepping back in with conviction.
• 🚀 Bullish Confirmation ($80,000+): A strong daily close back above $80,000 invalidates the short-term bearish pressure and reopens the path toward $84,500–$88,600.
💡 The Game Plan
Macro headwinds and tech-stock volatility have weighed on risk assets lately, making patience your biggest edge.
• Spot Investors: Gradual DCA entries inside the $70,000–$73,800 macro support band offer strong long-term value compared to buying local tops.
• Breakout Traders: Wait for a confirmed reclaim of $76,800 or $80,000 with rising volume before aggressively sizing into long positions.
Are you buying this $73K dip on $BTC or waiting for a test of $70,000? Drop your game plan below! 👇
#Bitcoin #BTC #CryptoAnalysis #TradingStrategy #TechnicalAnalysis #BinanceSquare
#
🚨 Bitcoin ($BTC ) Holding The Line At $73,800
While short-term panic shakes out weak hands, Bitcoin ($BTC ) is testing one of the most important macro support zones on the entire chart around $73,500–$73,900.
Here is the exact breakdown of what is happening on the $BTC chart right now!
🔍 The Technical Setup
• Testing Major Macro Support: After losing the psychological $80,000 handle earlier this month, BTC pulled back into the $73,000–$73,800 demand zone—a critical confluence area combining the 200-day moving average and the 20-week simple moving average.
• Momentum Reset: The daily RSI has cooled off below the 50 neutral line, wiping out overheated long leverage and resetting the market for a healthier, more sustainable move.
🗺️ Key Price Levels to Watch
• 🛡️ The Ultimate Floor ($73,000–$73,500): This is the line in the sand for bulls. Defending this zone keeps the broader multi-month bullish structure intact. A clean breakdown below $73,000 exposes the major psychological $70,000 support next.
• ⚡ Immediate Hurdle ($76,800–$78,000): Reclaiming the 21-week EMA near $76,875 is the first signal that buyers are stepping back in with conviction.
• 🚀 Bullish Confirmation ($80,000+): A strong daily close back above $80,000 invalidates the short-term bearish pressure and reopens the path toward $84,500–$88,600.
💡 The Game Plan
Macro headwinds and tech-stock volatility have weighed on risk assets lately, making patience your biggest edge.
• Spot Investors: Gradual DCA entries inside the $70,000–$73,800 macro support band offer strong long-term value compared to buying local tops.
• Breakout Traders: Wait for a confirmed reclaim of $76,800 or $80,000 with rising volume before aggressively sizing into long positions.
Are you buying this $73K dip on $BTC or waiting for a test of $70,000? Drop your game plan below! 👇
#Bitcoin #BTC #CryptoAnalysis #TradingStrategy #TechnicalAnalysis #BinanceSquare
🚨 Bitcoin ($BTC ) Holding The Line At $73,800
While short-term panic shakes out weak hands, Bitcoin ($BTC ) is testing one of the most important macro support zones on the entire chart around $73,500–$73,900.
Here is the exact breakdown of what is happening on the $BTC chart right now!
🔍 The Technical Setup
• Testing Major Macro Support: After losing the psychological $80,000 handle earlier this month, BTC pulled back into the $73,000–$73,800 demand zone—a critical confluence area combining the 200-day moving average and the 20-week simple moving average.
• Momentum Reset: The daily RSI has cooled off below the 50 neutral line, wiping out overheated long leverage and resetting the market for a healthier, more sustainable move.
🗺️ Key Price Levels to Watch
• 🛡️ The Ultimate Floor ($73,000–$73,500): This is the line in the sand for bulls. Defending this zone keeps the broader multi-month bullish structure intact. A clean breakdown below $73,000 exposes the major psychological $70,000 support next.
• ⚡ Immediate Hurdle ($76,800–$78,000): Reclaiming the 21-week EMA near $76,875 is the first signal that buyers are stepping back in with conviction.
• 🚀 Bullish Confirmation ($80,000+): A strong daily close back above $80,000 invalidates the short-term bearish pressure and reopens the path toward $84,500–$88,600.
💡 The Game Plan
Macro headwinds and tech-stock volatility have weighed on risk assets lately, making patience your biggest edge.
• Spot Investors: Gradual DCA entries inside the $70,000–$73,800 macro support band offer strong long-term value compared to buying local tops.
• Breakout Traders: Wait for a confirmed reclaim of $76,800 or $80,000 with rising volume before aggressively sizing into long positions.
Are you buying this $73K dip on $BTC or waiting for a test of $70,000? Drop your game plan below! 👇
#Bitcoin #BTC #CryptoAnalysis #TradingStrategy #TechnicalAnalysis #BinanceSquare
1
1
90
·
--
Рост
{spot}(LTCUSDT)
🚀 Litecoin ($LTC ) Is Coiling Up At $53.65
While the broader market debates its next macro move, Litecoin ($LTC) is quietly holding its ground in a prime accumulation zone around $53.65. Experienced traders know that prolonged consolidation near major structural support often precedes a sharp, high-momentum breakout.
Here is a breakdown of why $LTC is back on the radar for smart-money traders right now!
🔍 The Bullish Setup
• Deep Value Territory: The 14-day Relative Strength Index (RSI) sits near 37.5. Historically, dips into this lower band signal seller exhaustion and set the stage for a strong relief bounce.
• Built-In Scarcity: With roughly 77.78 million LTC already circulating out of a hard-capped 84 million max supply, over 92% of all Litecoin is already mined. High network utility paired with strict mathematical scarcity creates an ideal backdrop for a supply squeeze.
🗺️ Key Price Levels to Watch
• 🛡️ The Launchpad ($50.00): This major psychological and structural floor is being actively defended by spot buyers. Holding above $50 keeps the recovery structure intact.
• ⚡ First Hurdle ($62.00): A clean break and daily close above this local ceiling will trigger short liquidations and accelerate upside momentum.
• 🚀 Breakout Target ($70.00+): Clearing $62 opens a clear technical runway toward $70.00, confirming a broader bullish trend reversal.
💡 The Game Plan
With its fast 2.5minute block times and minimal transaction fees, Litecoin remains one of the most reliable peer-to-peer payment networks in crypto.
• Spot Investors: Accumulating gradually inside the $50.00–$54.00 demand zone offers a clean risk-to-reward profile ahead of the next broader market rotation.
• Breakout Traders: Wait for a confirmed 4H or daily candle close above $62.00 with rising volume before chasing momentum.
Are you stacking $LTC in this $50+ demand zone, or waiting for the $62 breakout confirmation? Drop your strategy in the comments! 👇
#Litecoin #LTC #CryptoTrading #Altcoins #TechnicalAnalysis #BinanceSquare
🚀 Litecoin ($LTC ) Is Coiling Up At $53.65
While the broader market debates its next macro move, Litecoin ($LTC ) is quietly holding its ground in a prime accumulation zone around $53.65. Experienced traders know that prolonged consolidation near major structural support often precedes a sharp, high-momentum breakout.
Here is a breakdown of why $LTC is back on the radar for smart-money traders right now!
🔍 The Bullish Setup
• Deep Value Territory: The 14-day Relative Strength Index (RSI) sits near 37.5. Historically, dips into this lower band signal seller exhaustion and set the stage for a strong relief bounce.
• Built-In Scarcity: With roughly 77.78 million LTC already circulating out of a hard-capped 84 million max supply, over 92% of all Litecoin is already mined. High network utility paired with strict mathematical scarcity creates an ideal backdrop for a supply squeeze.
🗺️ Key Price Levels to Watch
• 🛡️ The Launchpad ($50.00): This major psychological and structural floor is being actively defended by spot buyers. Holding above $50 keeps the recovery structure intact.
• ⚡ First Hurdle ($62.00): A clean break and daily close above this local ceiling will trigger short liquidations and accelerate upside momentum.
• 🚀 Breakout Target ($70.00+): Clearing $62 opens a clear technical runway toward $70.00, confirming a broader bullish trend reversal.
💡 The Game Plan
With its fast 2.5minute block times and minimal transaction fees, Litecoin remains one of the most reliable peer-to-peer payment networks in crypto.
• Spot Investors: Accumulating gradually inside the $50.00–$54.00 demand zone offers a clean risk-to-reward profile ahead of the next broader market rotation.
• Breakout Traders: Wait for a confirmed 4H or daily candle close above $62.00 with rising volume before chasing momentum.
Are you stacking $LTC in this $50+ demand zone, or waiting for the $62 breakout confirmation? Drop your strategy in the comments! 👇
#Litecoin #LTC #CryptoTrading #Altcoins #TechnicalAnalysis #BinanceSquare
🚀 Litecoin ($LTC ) Is Coiling Up At $53.65
While the broader market debates its next macro move, Litecoin ($LTC ) is quietly holding its ground in a prime accumulation zone around $53.65. Experienced traders know that prolonged consolidation near major structural support often precedes a sharp, high-momentum breakout.
Here is a breakdown of why $LTC is back on the radar for smart-money traders right now!
🔍 The Bullish Setup
• Deep Value Territory: The 14-day Relative Strength Index (RSI) sits near 37.5. Historically, dips into this lower band signal seller exhaustion and set the stage for a strong relief bounce.
• Built-In Scarcity: With roughly 77.78 million LTC already circulating out of a hard-capped 84 million max supply, over 92% of all Litecoin is already mined. High network utility paired with strict mathematical scarcity creates an ideal backdrop for a supply squeeze.
🗺️ Key Price Levels to Watch
• 🛡️ The Launchpad ($50.00): This major psychological and structural floor is being actively defended by spot buyers. Holding above $50 keeps the recovery structure intact.
• ⚡ First Hurdle ($62.00): A clean break and daily close above this local ceiling will trigger short liquidations and accelerate upside momentum.
• 🚀 Breakout Target ($70.00+): Clearing $62 opens a clear technical runway toward $70.00, confirming a broader bullish trend reversal.
💡 The Game Plan
With its fast 2.5minute block times and minimal transaction fees, Litecoin remains one of the most reliable peer-to-peer payment networks in crypto.
• Spot Investors: Accumulating gradually inside the $50.00–$54.00 demand zone offers a clean risk-to-reward profile ahead of the next broader market rotation.
• Breakout Traders: Wait for a confirmed 4H or daily candle close above $62.00 with rising volume before chasing momentum.
Are you stacking $LTC in this $50+ demand zone, or waiting for the $62 breakout confirmation? Drop your strategy in the comments! 👇
#Litecoin #LTC #CryptoTrading #Altcoins #TechnicalAnalysis #BinanceSquare
1
172
·
--
Рост
180
Войдите, чтобы посмотреть больше материала
Присоединяйтесь к пользователям криптовалют по всему миру на Binance Square
⚡️ Получайте новейшую и полезную информацию о криптоактивах.
💬 Нам доверяет крупнейшая в мире криптобиржа.
👍 Получите достоверные аналитические данные от верифицированных создателей контента.
Эл. почта/номер телефона
В тренде
AnthropicRejectsIPODelayValuationinQuestion
Просмотров: 541,059
4,475 обсуждают
Share Your Takes: Can Anthropic Hold a $1 Trillion+ Valuation?
Binance Square Official
·Лайков: 139
·Просмотров: 93k
BitMineReports$6.3BNetLossForFiscal2026
Просмотров: 249
37 обсуждают
CoreWeaveJumps10%On168%RevenueGrowth
Просмотров: 104,359
1,235 обсуждают