
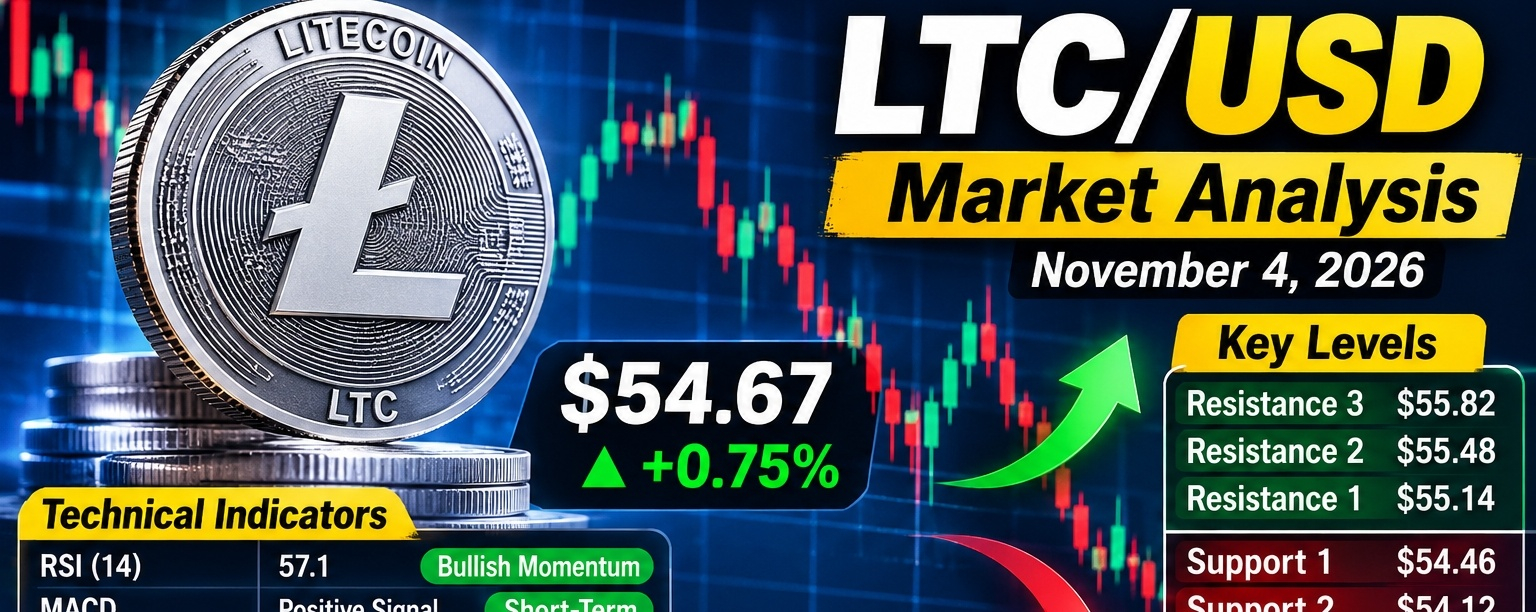

$LTC /USD Analysis — November 4, 2026
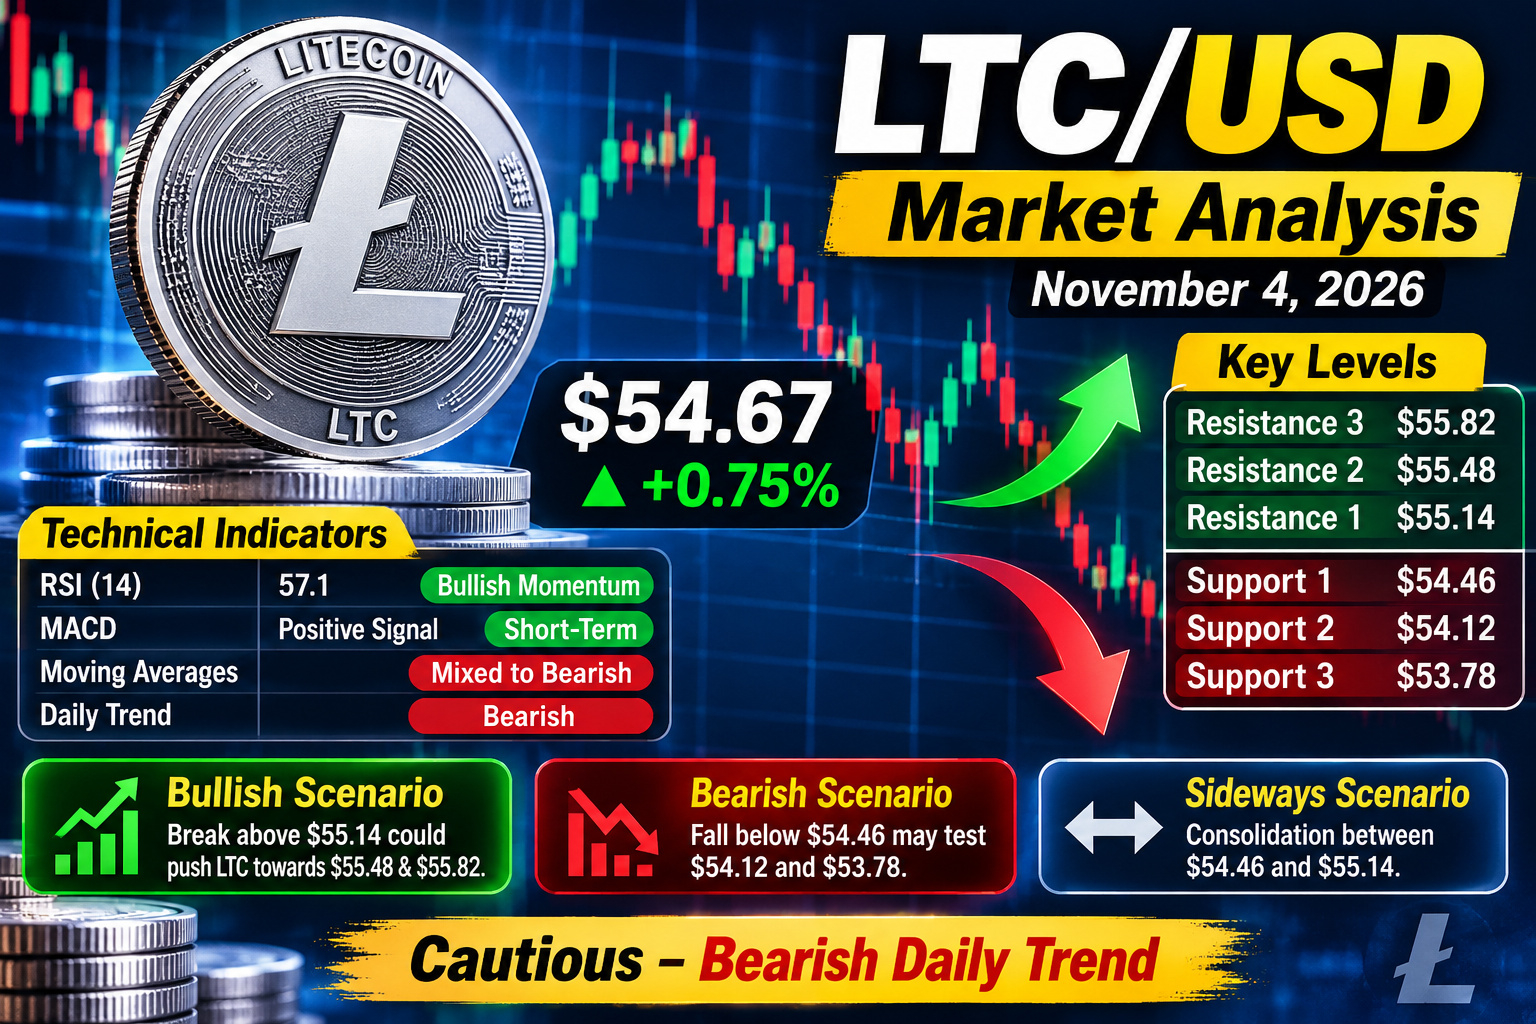
Market: Litecoin ($LTC ) / US Dollar (USD)


### $54.67
+0.75% daily
Latest reported market price OHLCX Markets +1
### 1\. Market overview
Litecoin is showing a short-term recovery attempt, but the broader daily trend remains weak. Technical indicators are giving mixed signals: shorter-term momentum has improved, while the daily trend still favors sellers. OHLCX Markets +1
* Short-term trend: Mildly bullish recovery
* Daily trend: Bearish
* Momentum: Mixed, with a possible relief bounce
* Trading risk: Elevated volatility
### 2\. Key support and resistance levels
Based on the latest available technical readings around the $54–$55 area: OHLCX Markets +1
| Level | Price (USD) | Significance |
| ------------ | ----------- | -------------------------- |
| Resistance 3 | $55.82 | Higher breakout zone |
| Resistance 2 | $55.48 | Bullish continuation level |
| Resistance 1 | $55.14 | First resistance |
| Support 1 | $54.46 | Near-term support |
| Support 2 | $54.12 | Important downside level |
| Support 3 | $53.78 | Further bearish target |
These are reference levels, not guaranteed turning points.
### 3\. Technical indicators
RSI (14)
### 57.1
Bullish momentum
MACD
### Positive signal
Short-term
Moving averages
Mixed to bearish
Daily trend
Bearish
The indicator readings vary by exchange and update time. Daily technical summaries remain weak, even though some shorter-term indicators suggest recovery potential. OHLCX Markets +1
### 4\. Possible trading scenarios
Bullish scenario
If LTC breaks above $55.14 and holds, the next areas to watch are $55.48 and $55.82. A sustained breakout with strong volume would improve the short-term outlook.
Bearish scenario
If LTC falls below $54.46, watch $54.12 and $53.78. A decisive break below $53.78 could indicate additional downside pressure.
Sideways scenario
If price remains between approximately $54.46 and $55.14, LTC may consolidate before choosing its next direction.
### 5\. Final outlook
Cautious — bearish daily trend
* Short-term: A recovery is possible if buying momentum continues.
* Daily timeframe: Sellers retain an advantage until resistance is broken convincingly.
* Trade approach: Wait for confirmation rather than entering solely on a small price bounce.
* Risk management: Use a predefined stop-loss and avoid excessive leverage.
This is technical market analysis, not a guaranteed prediction or financial advice. Crypto prices can change rapidly, a
nd the levels above should be verified against your exchange's live chart before trading.
#LTC📈 #LTCPricePrediction #LTC/USD #viralpost