xagSilver’s Multi-Decade Breakout: The Start of a New Bull Run? 📈🥈
Analyzing the historical silver (monthly) chart from 1974 to 2026, we are witnessing a potentially historic moment.
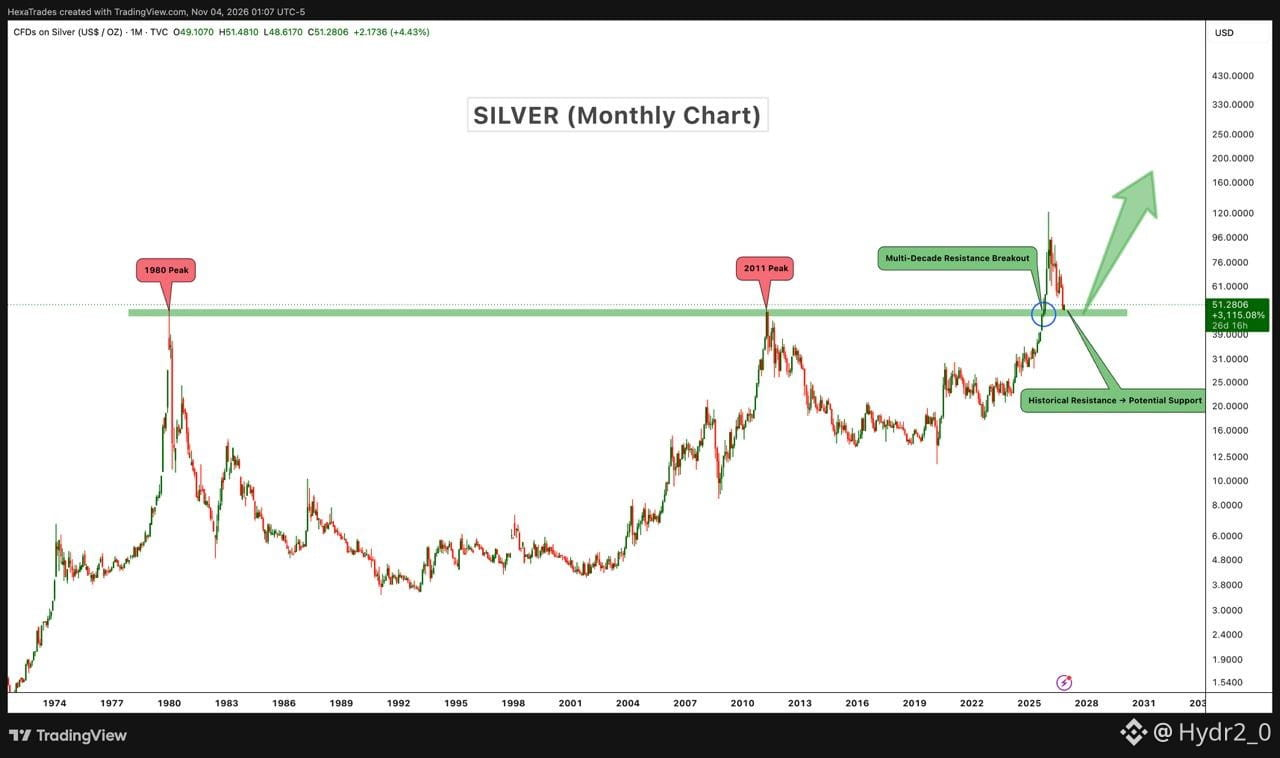
For over forty years, the ~$50 level has acted as an impenetrable ceiling, marking major peaks in 1980 and 2011. After decades of consolidation, silver has finally staged a Multi-Decade Resistance Breakout, pushing through this critical barrier.
What's next?
The chart points to a classic "break and retest" pattern. The former historical resistance is now expected to act as a potential support zone (around the $40–$50 range). If this level holds, it could pave the way for an aggressive, long-term bullish trend toward much higher, uncharted targets (illustrated by the large green arrow pointing upward toward the $120+ range).
Is the silver bull officially unleashed? Let’s watch the retest! 🚀$XAG
Analyzing the historical silver (monthly) chart from 1974 to 2026, we are witnessing a potentially historic moment.
For over forty years, the ~$50 level has acted as an impenetrable ceiling, marking major peaks in 1980 and 2011. After decades of consolidation, silver has finally staged a Multi-Decade Resistance Breakout, pushing through this critical barrier.
What's next?
The chart points to a classic "break and retest" pattern. The former historical resistance is now expected to act as a potential support zone (around the $40–$50 range). If this level holds, it could pave the way for an aggressive, long-term bullish trend toward much higher, uncharted targets (illustrated by the large green arrow pointing upward toward the $120+ range).
Is the silver bull officially unleashed? Let’s watch the retest! 🚀$XAG