*
📊 🚨📊 ZEC / USDT - FULL CHART ANALYSIS (Educational)
Coin: Zcash $ZEC
Timeframe: 1D
Trend: UPTREND +18.4%
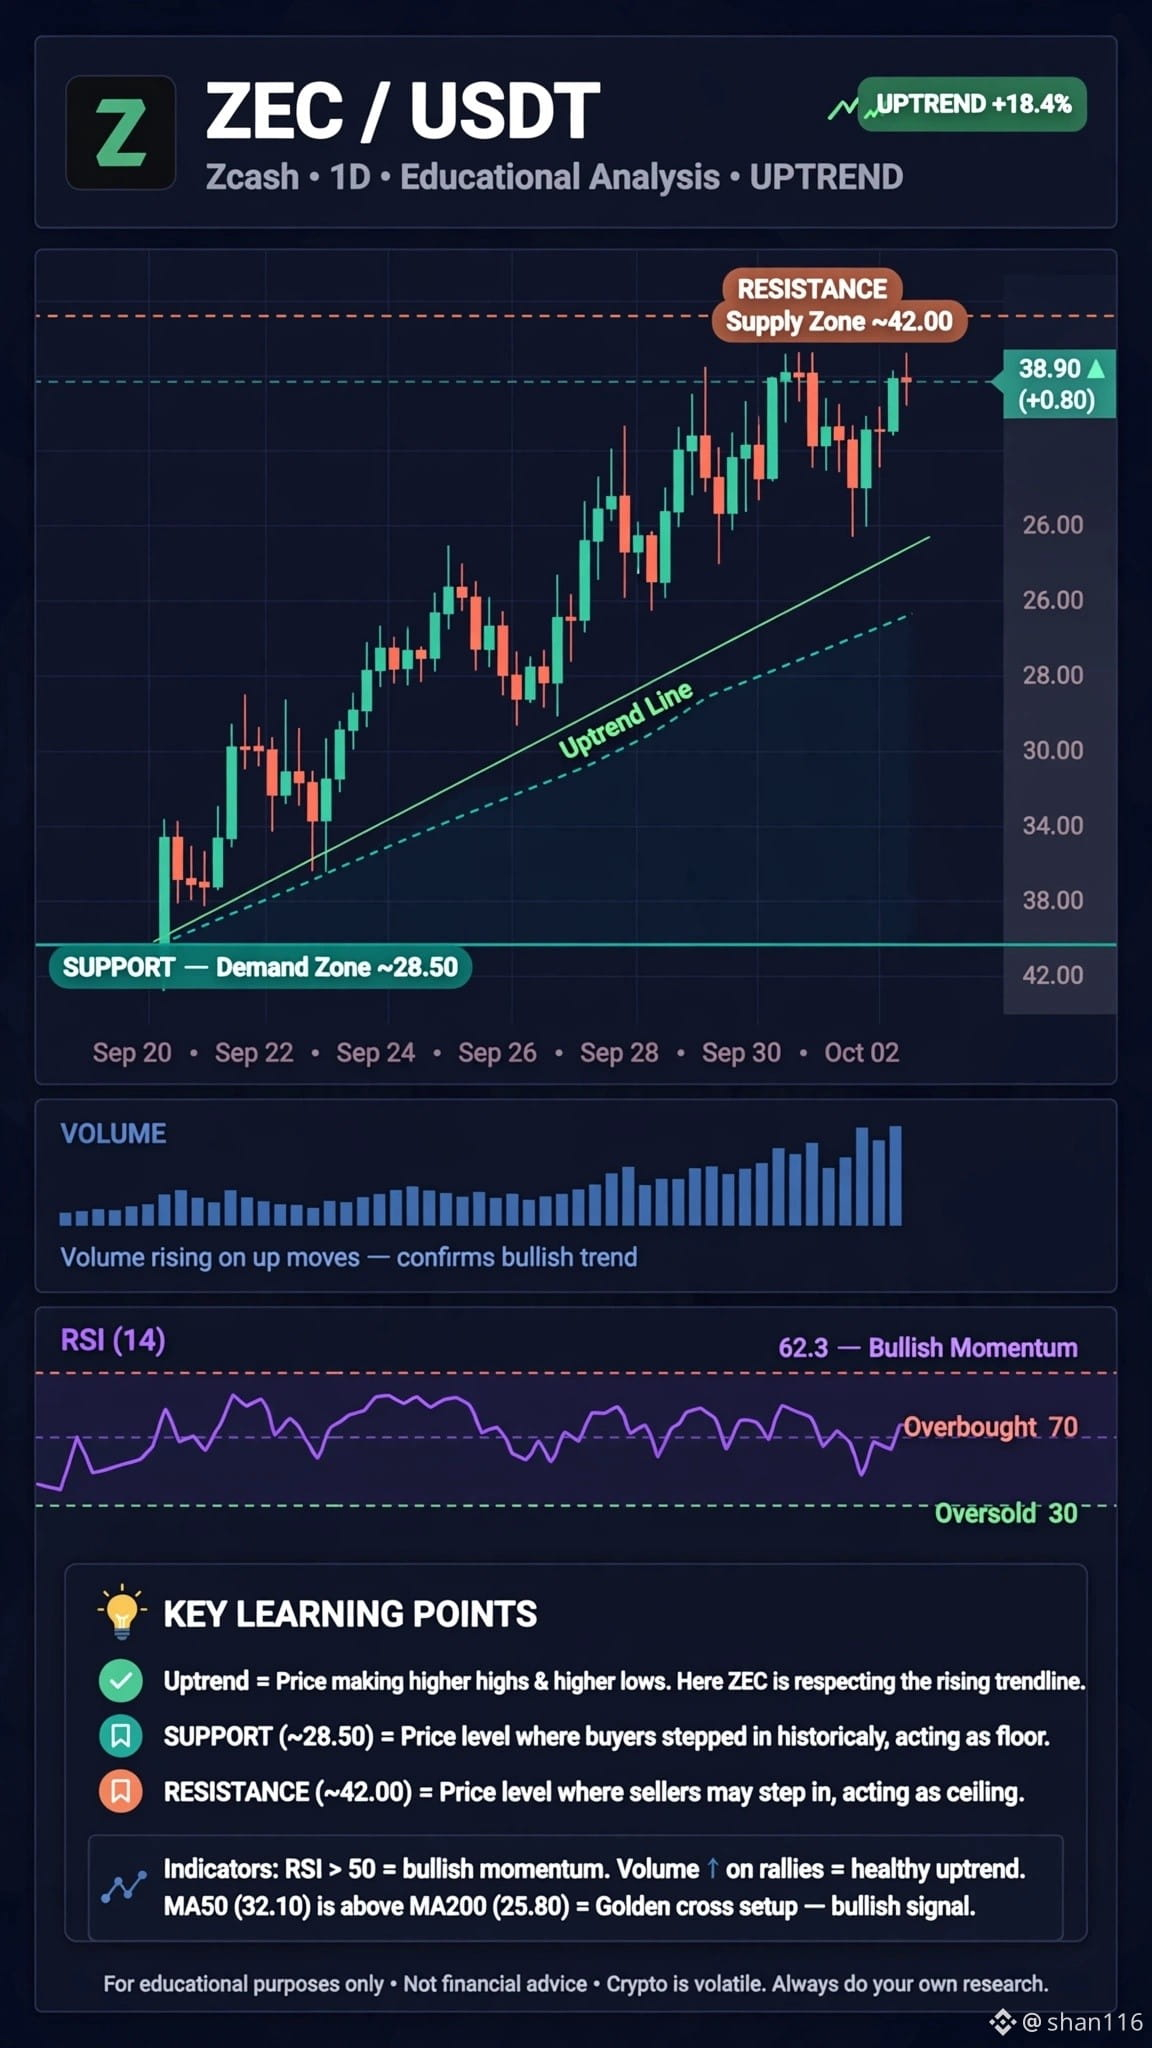
🔍 WHAT THE CHART IS SHOWING:
1. TRENDLINE:
Price is respecting the rising Uptrend Line perfectly.
Higher Highs + Higher Lows = Healthy Bullish Structure
2. SUPPORT - Demand Zone:
Around $1,125 area (chart shows historical demand)
This is where buyers stepped in last time. Price bounced from here.
3. RESISTANCE - Supply Zone:
Around $1,320 - $1,350 area
This is where sellers were active before. Need strong volume to break it.
4. VOLUME:
Volume rising on up moves = Confirms trend is REAL, not fake pump
Falling volume on pullbacks = Buyers still in control
5. RSI (14) = 62.3
Above 50 = Bullish Momentum
Below 70 = Not overbought yet, still room to move
6. MOVING AVERAGE:
MA50 is above MA200 = Golden Cross setup = Long-term bullish signal
MY LEARNING:
I don't chase green candles. I wait for price to test Support or Break Resistance with volume.
That's how pros trade.
What do YOU see on this chart? Bullish or Bearish? Comment 👇
Follow for Daily Chart Analysis - Learn to trade like a pro!
#ZEC #Zcash #TechnicalAnalysis #CryptoAnalysis #ChartAnalysis #TradingView #BTC #BinanceSquare #LearnCrypto
📊 🚨📊 ZEC / USDT - FULL CHART ANALYSIS (Educational)
Coin: Zcash $ZEC
Timeframe: 1D
Trend: UPTREND +18.4%
🔍 WHAT THE CHART IS SHOWING:
1. TRENDLINE:
Price is respecting the rising Uptrend Line perfectly.
Higher Highs + Higher Lows = Healthy Bullish Structure
2. SUPPORT - Demand Zone:
Around $1,125 area (chart shows historical demand)
This is where buyers stepped in last time. Price bounced from here.
3. RESISTANCE - Supply Zone:
Around $1,320 - $1,350 area
This is where sellers were active before. Need strong volume to break it.
4. VOLUME:
Volume rising on up moves = Confirms trend is REAL, not fake pump
Falling volume on pullbacks = Buyers still in control
5. RSI (14) = 62.3
Above 50 = Bullish Momentum
Below 70 = Not overbought yet, still room to move
6. MOVING AVERAGE:
MA50 is above MA200 = Golden Cross setup = Long-term bullish signal
MY LEARNING:
I don't chase green candles. I wait for price to test Support or Break Resistance with volume.
That's how pros trade.
What do YOU see on this chart? Bullish or Bearish? Comment 👇
Follow for Daily Chart Analysis - Learn to trade like a pro!
#ZEC #Zcash #TechnicalAnalysis #CryptoAnalysis #ChartAnalysis #TradingView #BTC #BinanceSquare #LearnCrypto