$RENDER: Interpreting RENDER Trading Depth
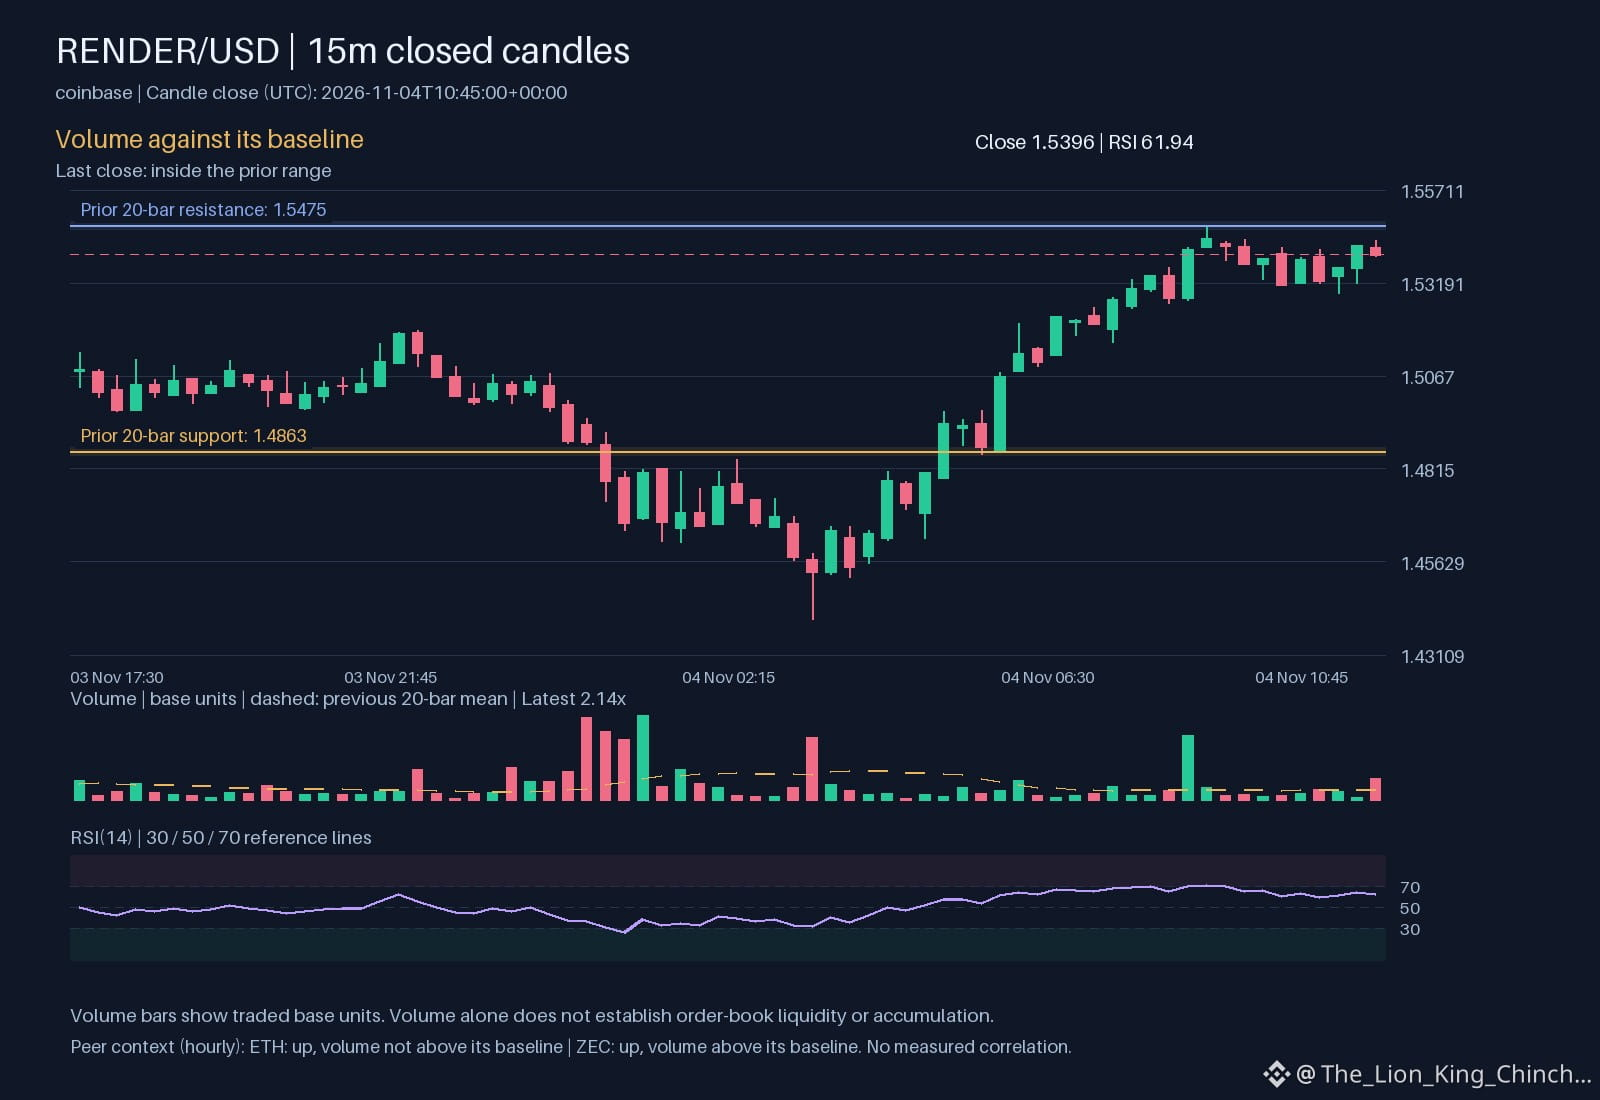
The primary question for $RENDER involves the strength of its current hourly direction. When price moves up and volume remains 2.14212, we observe active engagement. This suggests that the current level is attracting more than just passive interest. However, identifying a trend on a leaderboard does not explain the underlying strength of the move.
Comparing $RENDER to peers provides a useful contrast in how activity manifests. ETH shows an hourly direction up with volume staying below its baseline. In contrast, ZEC moves up with volume above its baseline. These variations show that while the broad market might move together, the intensity of participant interest varies significantly across different assets. A similar direction across these tokens is not a measured correlation or a sign of capital rotation. It is simply a snapshot of independent movements happening at the same time.
What matters most is whether the move holds. If $RENDER stays above 1.4863 while activity cools, the move may be stabilizing. If it fails to hold 1.5475, the recent volume might represent a temporary peak. One way to reassess this is to monitor the RSI at 61.9406 alongside the MACD at 0.0114085. If these indicators diverge while volume drops, the current direction might lack sustainability. Watching these limits helps distinguish a brief spike from a lasting change in market sentiment.
Probabilistic market research, not a recommendation or guaranteed return.
The comparison to keep in mind: $ETH has hourly direction up and volume not above its baseline; $ZEC has hourly direction up and volume above its baseline. This alone does not establish correlation.
Which matters more in this comparison: direction or how the move holds?
#RENDER #ETH #ZEC #CryptoWatchlist
The primary question for $RENDER involves the strength of its current hourly direction. When price moves up and volume remains 2.14212, we observe active engagement. This suggests that the current level is attracting more than just passive interest. However, identifying a trend on a leaderboard does not explain the underlying strength of the move.
Comparing $RENDER to peers provides a useful contrast in how activity manifests. ETH shows an hourly direction up with volume staying below its baseline. In contrast, ZEC moves up with volume above its baseline. These variations show that while the broad market might move together, the intensity of participant interest varies significantly across different assets. A similar direction across these tokens is not a measured correlation or a sign of capital rotation. It is simply a snapshot of independent movements happening at the same time.
What matters most is whether the move holds. If $RENDER stays above 1.4863 while activity cools, the move may be stabilizing. If it fails to hold 1.5475, the recent volume might represent a temporary peak. One way to reassess this is to monitor the RSI at 61.9406 alongside the MACD at 0.0114085. If these indicators diverge while volume drops, the current direction might lack sustainability. Watching these limits helps distinguish a brief spike from a lasting change in market sentiment.
Probabilistic market research, not a recommendation or guaranteed return.
The comparison to keep in mind: $ETH has hourly direction up and volume not above its baseline; $ZEC has hourly direction up and volume above its baseline. This alone does not establish correlation.
Which matters more in this comparison: direction or how the move holds?
#RENDER #ETH #ZEC #CryptoWatchlist