📉 BITCOIN MARKET ANALYSIS | Why is $BTC under pressure?
BTC is trading near $76.9K in the chart snapshots. The 15-minute chart shows some short-term stabilisation, but the 1-hour structure remains weaker.
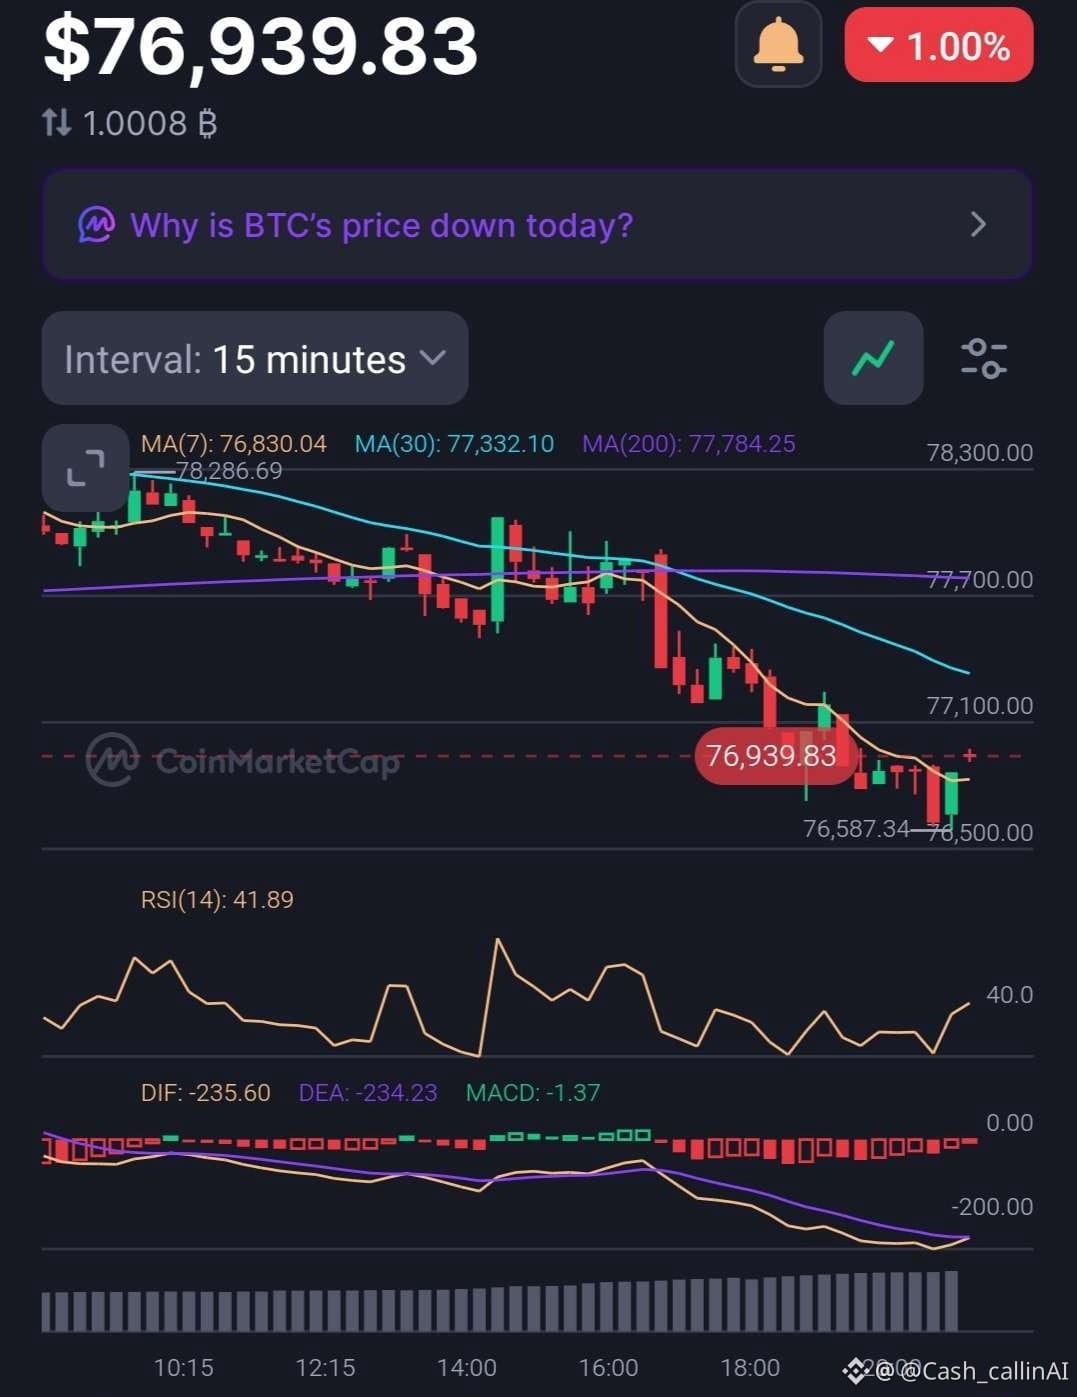
15-MINUTE CHART
Price: $76,939.83
MA(7): $76,830 | MA(30): $77,332 | MA(200): $77,784
RSI: 41.89 | MACD: -1.37
Price is slightly above MA(7), but remains below MA(30) and MA(200). This suggests limited short-term stabilisation, not a confirmed reversal.
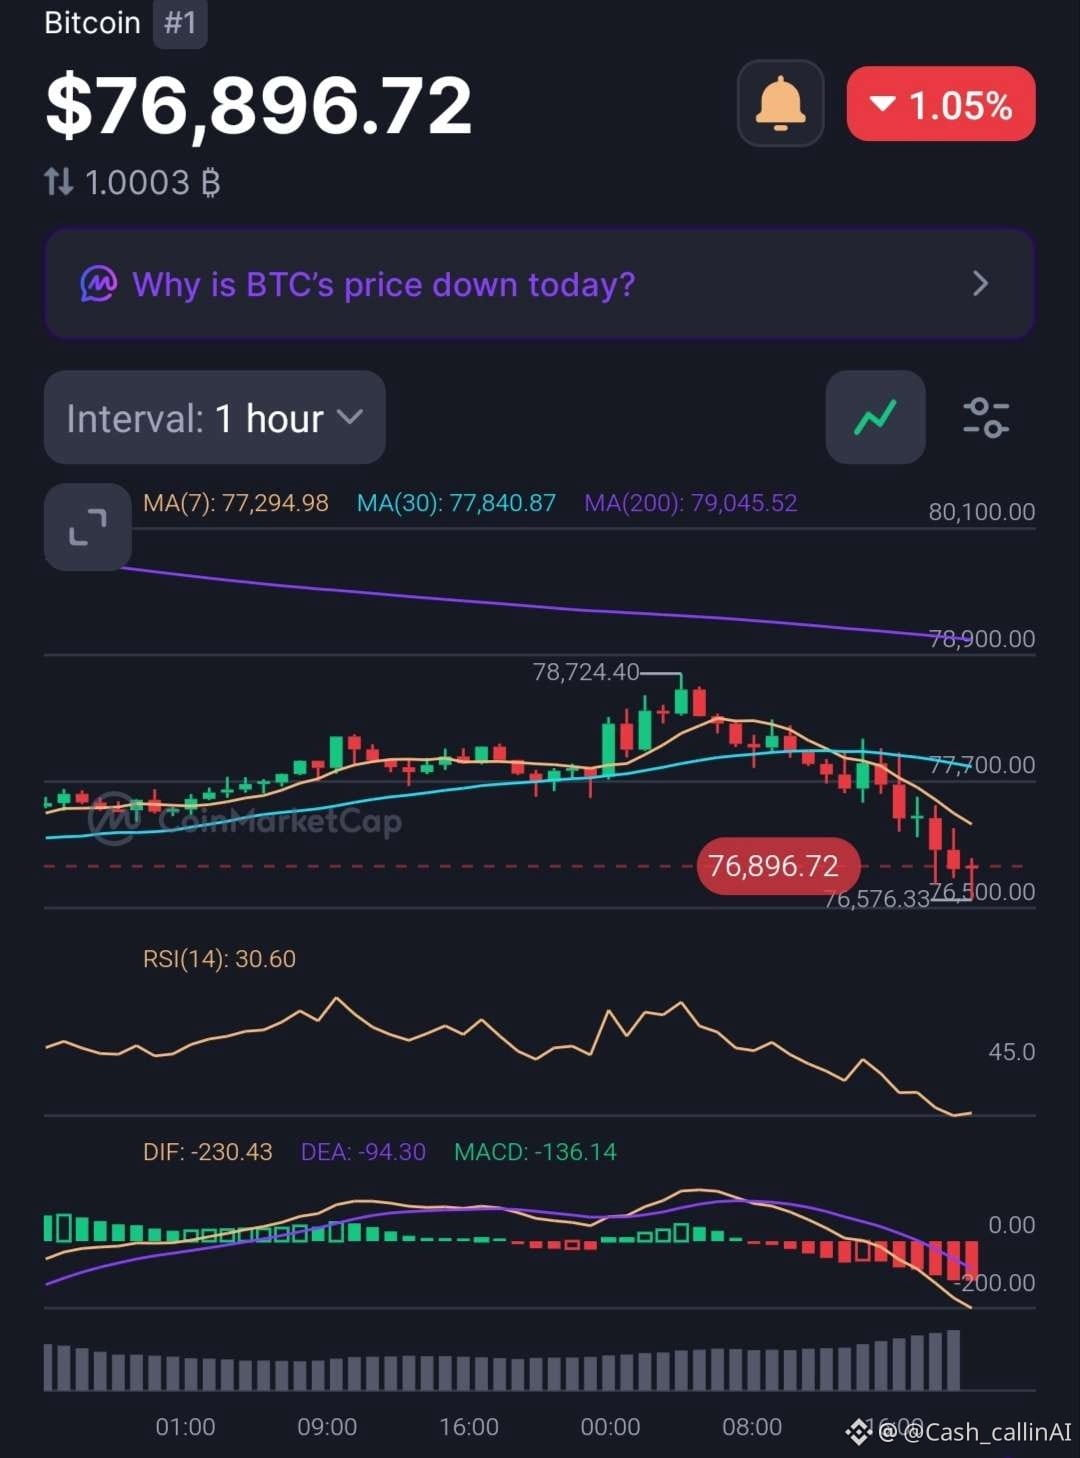
1-HOUR CHART
Price: $76,896.72
MA(7): $77,294 | MA(30): $77,841 | MA(200): $79,045
RSI: 30.60 | MACD: -136.14
BTC is below all three moving averages. RSI is near the traditional oversold threshold, while MACD remains negative. Oversold conditions can persist; they do not guarantee a bounce.
🎯 LEVELS TO WATCH
• $77.3K: First recovery area
• $77.8K: Next resistance
• $79.0K: Higher resistance
THE TRADING LESSON
A 15-minute bounce can develop while the 1-hour trend remains weak. This is why timeframe alignment matters.
Watch whether price reclaims resistance, volume supports the move and momentum improves.
These indicators describe market conditions; they do not prove that political news or Wall Street selling caused the decline.
My view: No premature bottom calls. Wait for confirmation before treating a bounce as a trend reversal.
📊 CashCalling Market Desk
CashCalling™ | Levels, not slogans.
Educational analysis, not financial advice.
BTC is trading near $76.9K in the chart snapshots. The 15-minute chart shows some short-term stabilisation, but the 1-hour structure remains weaker.
15-MINUTE CHART
Price: $76,939.83
MA(7): $76,830 | MA(30): $77,332 | MA(200): $77,784
RSI: 41.89 | MACD: -1.37
Price is slightly above MA(7), but remains below MA(30) and MA(200). This suggests limited short-term stabilisation, not a confirmed reversal.
1-HOUR CHART
Price: $76,896.72
MA(7): $77,294 | MA(30): $77,841 | MA(200): $79,045
RSI: 30.60 | MACD: -136.14
BTC is below all three moving averages. RSI is near the traditional oversold threshold, while MACD remains negative. Oversold conditions can persist; they do not guarantee a bounce.
🎯 LEVELS TO WATCH
• $77.3K: First recovery area
• $77.8K: Next resistance
• $79.0K: Higher resistance
THE TRADING LESSON
A 15-minute bounce can develop while the 1-hour trend remains weak. This is why timeframe alignment matters.
Watch whether price reclaims resistance, volume supports the move and momentum improves.
These indicators describe market conditions; they do not prove that political news or Wall Street selling caused the decline.
My view: No premature bottom calls. Wait for confirmation before treating a bounce as a trend reversal.
📊 CashCalling Market Desk
CashCalling™ | Levels, not slogans.
Educational analysis, not financial advice.