🔶 **Market Overview**
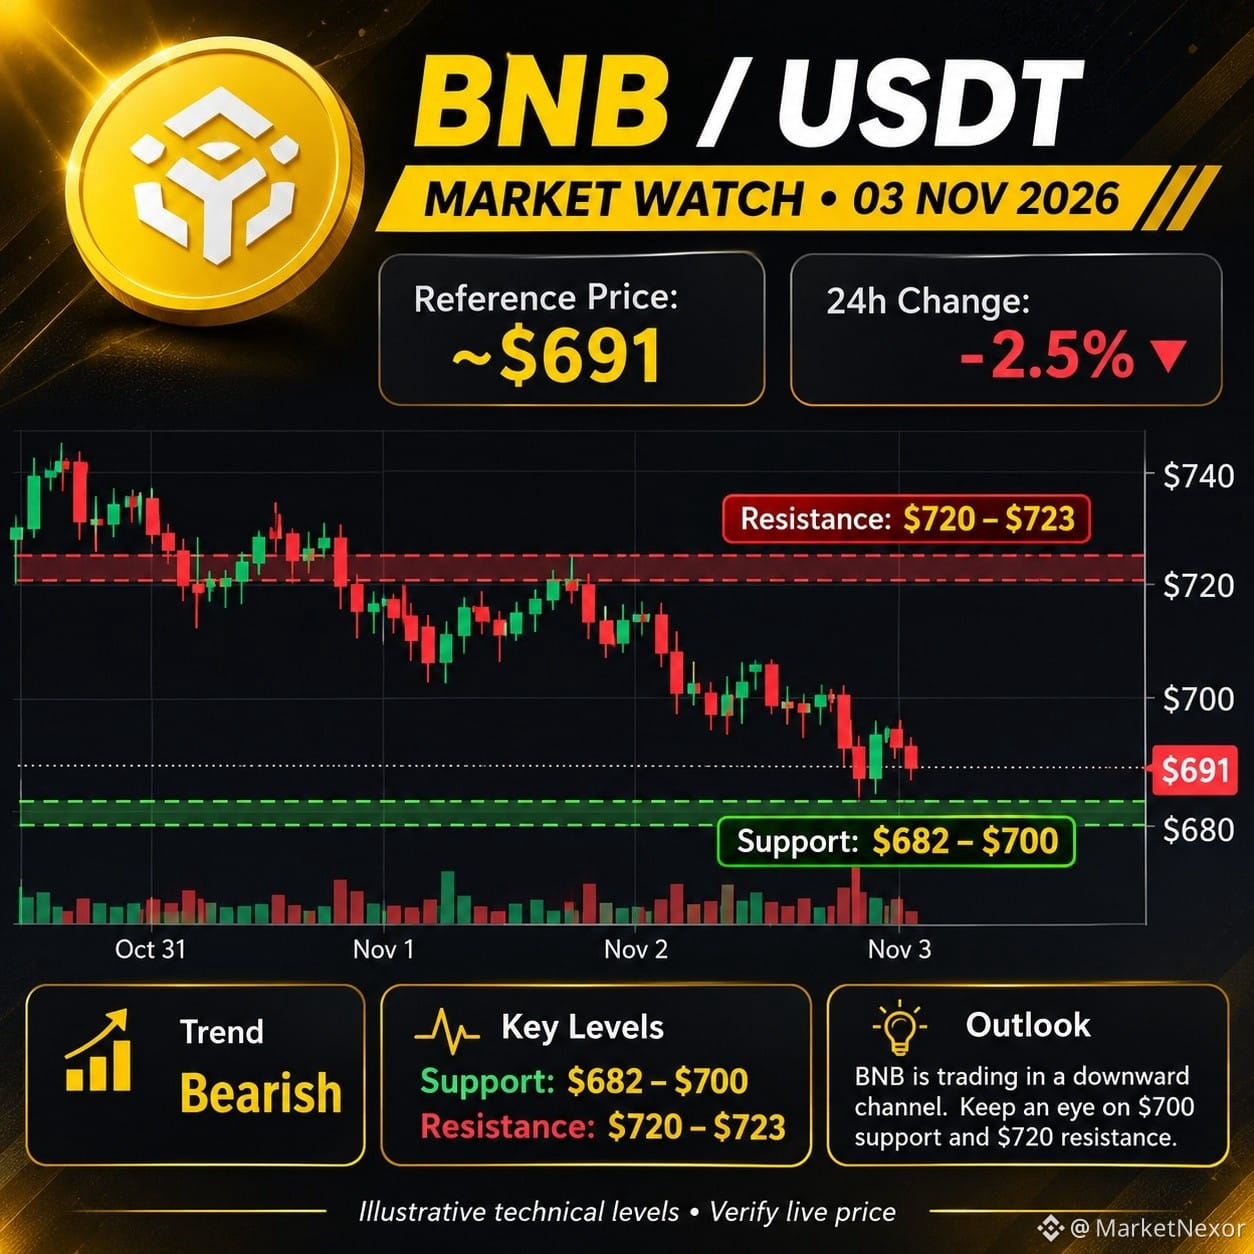
$BNB is facing selling pressure, trading near $691 with a negative 24-hour performance. The short-term market structure appears bearish, and traders are watching key support levels.
📉 **Key Technical Levels**
🟢 Support Zone: $682–$700
🔴 Resistance Zone: $720–$723
📈 **Bullish Scenario**
If BNB recovers and breaks above $723 with strong buying volume, bullish momentum could improve.
📉 **Bearish Scenario**
If BNB fails to hold the $682–$700 support zone, selling pressure could increase.
🔍 **What to Watch**
• Bitcoin's overall market direction
• BNB trading volume
• Price reaction around support and resistance
• A confirmed breakout before drawing conclusions
💡 **My Outlook:** $BNB remains under short-term pressure. A clear recovery above resistance or a breakdown below support will provide a stronger directional signal.
⚠️ This analysis is for educational purposes only, not financial advice. Prices and technical levels can change quickly. Verify live market data before making decisions.
#BinanceReopensWithdrawalsForMoreAssets #AppleReportsMixedResults #BinanceSquareTalks
$BNB is facing selling pressure, trading near $691 with a negative 24-hour performance. The short-term market structure appears bearish, and traders are watching key support levels.
📉 **Key Technical Levels**
🟢 Support Zone: $682–$700
🔴 Resistance Zone: $720–$723
📈 **Bullish Scenario**
If BNB recovers and breaks above $723 with strong buying volume, bullish momentum could improve.
📉 **Bearish Scenario**
If BNB fails to hold the $682–$700 support zone, selling pressure could increase.
🔍 **What to Watch**
• Bitcoin's overall market direction
• BNB trading volume
• Price reaction around support and resistance
• A confirmed breakout before drawing conclusions
💡 **My Outlook:** $BNB remains under short-term pressure. A clear recovery above resistance or a breakdown below support will provide a stronger directional signal.
⚠️ This analysis is for educational purposes only, not financial advice. Prices and technical levels can change quickly. Verify live market data before making decisions.
#BinanceReopensWithdrawalsForMoreAssets #AppleReportsMixedResults #BinanceSquareTalks